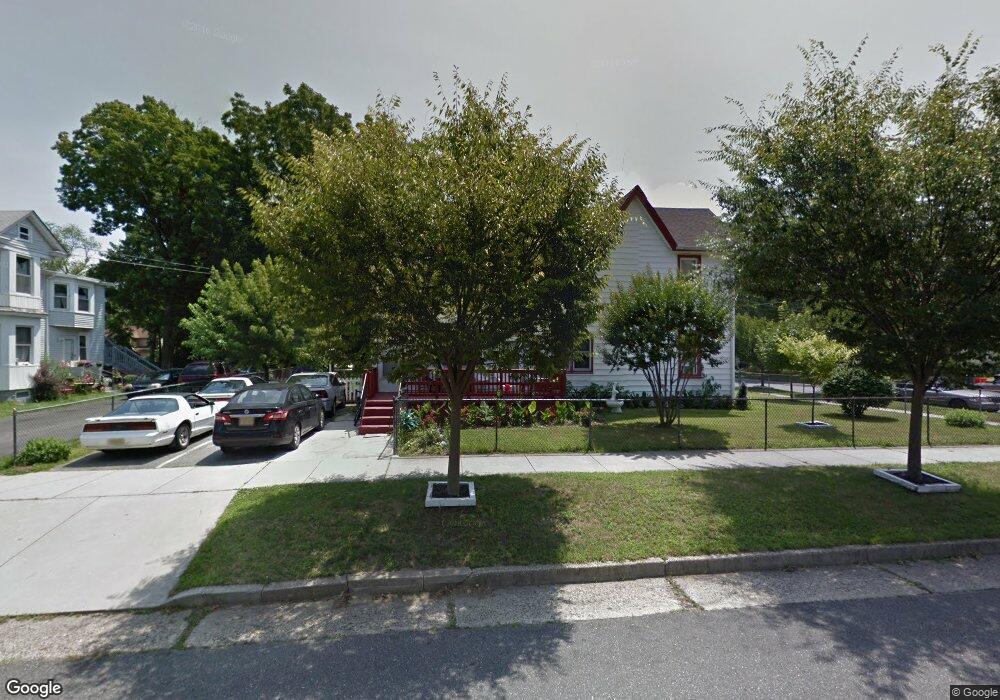
301 N 8th St Vineland, NJ 08360
Estimated Value: $274,153 - $328,000
--
Bed
--
Bath
2,791
Sq Ft
$106/Sq Ft
Est. Value
About This Home
This home is located at 301 N 8th St, Vineland, NJ 08360 and is currently estimated at $295,538, approximately $105 per square foot. 301 N 8th St is a home located in Cumberland County with nearby schools including D'Ippolito Elementary School, Veterans Memorial Intermediate School, and Vineland Senior High School.
Ownership History
Date
Name
Owned For
Owner Type
Purchase Details
Closed on
Feb 8, 2011
Sold by
Gonzalez Jose A
Bought by
Hampton Norman Todd and Hampton Marie
Current Estimated Value
Home Financials for this Owner
Home Financials are based on the most recent Mortgage that was taken out on this home.
Original Mortgage
$112,500
Outstanding Balance
$76,871
Interest Rate
4.75%
Mortgage Type
Purchase Money Mortgage
Estimated Equity
$218,667
Purchase Details
Closed on
Aug 30, 2006
Sold by
Velez Jose B
Bought by
Gonzalez Jose A
Create a Home Valuation Report for This Property
The Home Valuation Report is an in-depth analysis detailing your home's value as well as a comparison with similar homes in the area
Home Values in the Area
Average Home Value in this Area
Purchase History
| Date | Buyer | Sale Price | Title Company |
|---|---|---|---|
| Hampton Norman Todd | $150,000 | -- | |
| Gonzalez Jose A | $125,000 | -- |
Source: Public Records
Mortgage History
| Date | Status | Borrower | Loan Amount |
|---|---|---|---|
| Open | Hampton Norman Todd | $112,500 |
Source: Public Records
Tax History Compared to Growth
Tax History
| Year | Tax Paid | Tax Assessment Tax Assessment Total Assessment is a certain percentage of the fair market value that is determined by local assessors to be the total taxable value of land and additions on the property. | Land | Improvement |
|---|---|---|---|---|
| 2025 | $4,359 | $136,900 | $17,700 | $119,200 |
| 2024 | $4,359 | $136,900 | $17,700 | $119,200 |
| 2023 | $4,330 | $136,900 | $17,700 | $119,200 |
| 2022 | $4,201 | $136,900 | $17,700 | $119,200 |
| 2021 | $4,125 | $136,900 | $17,700 | $119,200 |
| 2020 | $4,007 | $136,900 | $17,700 | $119,200 |
| 2019 | $3,952 | $136,900 | $17,700 | $119,200 |
| 2018 | $3,848 | $136,900 | $17,700 | $119,200 |
| 2017 | $3,655 | $136,900 | $17,700 | $119,200 |
| 2016 | $3,527 | $136,900 | $17,700 | $119,200 |
| 2015 | $3,396 | $136,900 | $17,700 | $119,200 |
| 2014 | $3,212 | $136,900 | $17,700 | $119,200 |
Source: Public Records
Map
Nearby Homes