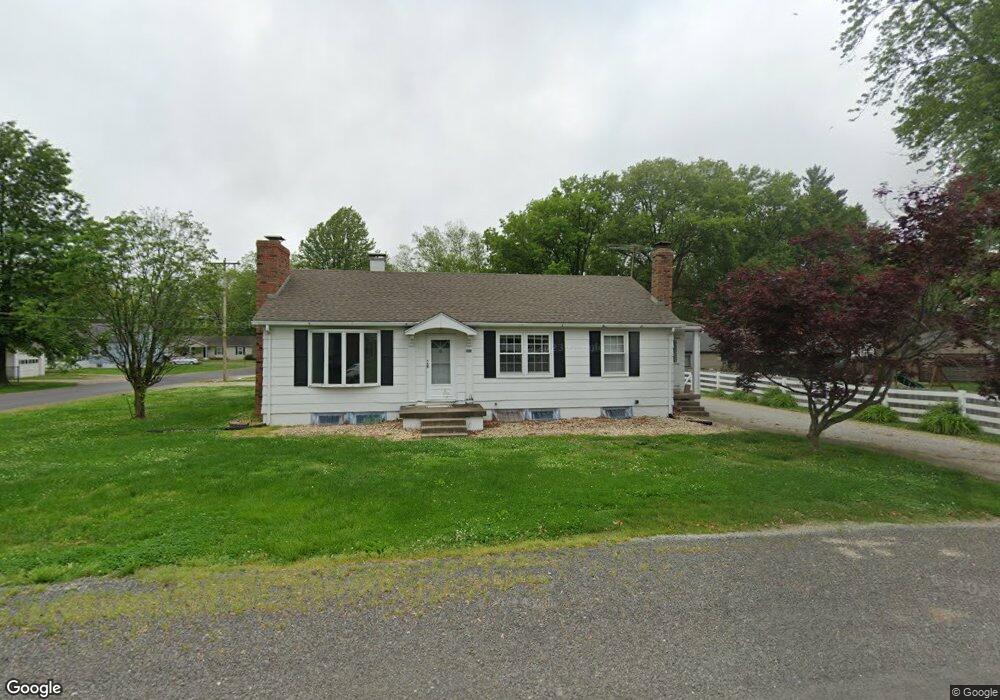
301 N Cherry St Freeburg, IL 62243
Estimated Value: $200,000 - $221,282
--
Bed
--
Bath
1,260
Sq Ft
$167/Sq Ft
Est. Value
About This Home
This home is located at 301 N Cherry St, Freeburg, IL 62243 and is currently estimated at $210,321, approximately $166 per square foot. 301 N Cherry St is a home located in St. Clair County with nearby schools including Freeburg Elementary School, Freeburg Community High School, and St. Joseph Catholic School.
Ownership History
Date
Name
Owned For
Owner Type
Purchase Details
Closed on
Nov 17, 2022
Sold by
Becherer Scott G and Becherer Dovie E
Bought by
Schmidt Jake and Schmidt Christophe Rahel
Current Estimated Value
Purchase Details
Closed on
Dec 31, 2018
Sold by
Greenlee Anita R and Dierker Anita R
Bought by
Becherer Scott G and Becherer Dovie E
Home Financials for this Owner
Home Financials are based on the most recent Mortgage that was taken out on this home.
Original Mortgage
$147,283
Interest Rate
5.25%
Mortgage Type
FHA
Purchase Details
Closed on
Dec 10, 2007
Sold by
Linss Opal M
Bought by
Greenlee Anita R
Home Financials for this Owner
Home Financials are based on the most recent Mortgage that was taken out on this home.
Original Mortgage
$112,500
Interest Rate
6.31%
Mortgage Type
Purchase Money Mortgage
Create a Home Valuation Report for This Property
The Home Valuation Report is an in-depth analysis detailing your home's value as well as a comparison with similar homes in the area
Home Values in the Area
Average Home Value in this Area
Purchase History
| Date | Buyer | Sale Price | Title Company |
|---|---|---|---|
| Schmidt Jake | $162,000 | Town & Country Title | |
| Becherer Scott G | $150,000 | Town & County Title Co | |
| Greenlee Anita R | $151,500 | Metro East Title |
Source: Public Records
Mortgage History
| Date | Status | Borrower | Loan Amount |
|---|---|---|---|
| Previous Owner | Becherer Scott G | $147,283 | |
| Previous Owner | Greenlee Anita R | $112,500 |
Source: Public Records
Tax History Compared to Growth
Tax History
| Year | Tax Paid | Tax Assessment Tax Assessment Total Assessment is a certain percentage of the fair market value that is determined by local assessors to be the total taxable value of land and additions on the property. | Land | Improvement |
|---|---|---|---|---|
| 2024 | $5,364 | $64,149 | $10,008 | $54,141 |
| 2023 | $5,338 | $62,944 | $9,659 | $53,285 |
| 2022 | $4,592 | $58,981 | $9,051 | $49,930 |
| 2021 | $4,417 | $55,527 | $8,521 | $47,006 |
| 2020 | $4,188 | $50,515 | $7,752 | $42,763 |
| 2019 | $4,353 | $54,482 | $8,012 | $46,470 |
| 2018 | $4,274 | $53,762 | $7,906 | $45,856 |
| 2017 | $4,069 | $51,403 | $7,559 | $43,844 |
| 2016 | $4,015 | $49,265 | $7,245 | $42,020 |
| 2014 | $3,543 | $49,267 | $7,434 | $41,833 |
| 2013 | $3,298 | $48,828 | $7,368 | $41,460 |
Source: Public Records
Map
Nearby Homes
- 207 N Edison St
- 401 N Edison St
- 520 N Edison St
- 106 S Vine St
- 206 N Main St
- 312 W Phillips St
- 302 N Railroad St
- 3 Park St
- 0 Hickory Dr
- 103 Draco Dr
- 420 Foxtail Dr
- 440 Foxtail Dr
- 433 Foxtail Dr
- 109 Willow Dr
- 111 Willow Dr
- 304 Torrington Ln
- 363 Sleeping Indian Dr
- 359 Sleeping Indian Dr
- 222 Alamosa Dr
- 227 Alamosa Dr
- 305 N Cherry St
- 211 N Cherry St
- 302 N Edison St
- 201 E Mill St
- 306 N Edison St
- 212 N Edison St
- 110 E Temple St
- 200 E Mill St
- 205 E Mill St
- 202 E Temple St
- 310 N Edison St
- 210 N Cherry St
- 208 N Edison St
- 207 N Cherry St
- 206 N Cherry St
- 209 E Mill St
- 301 N Edison St
- 206 E Temple St
- 203 N Cherry St
- 307 N Edison St