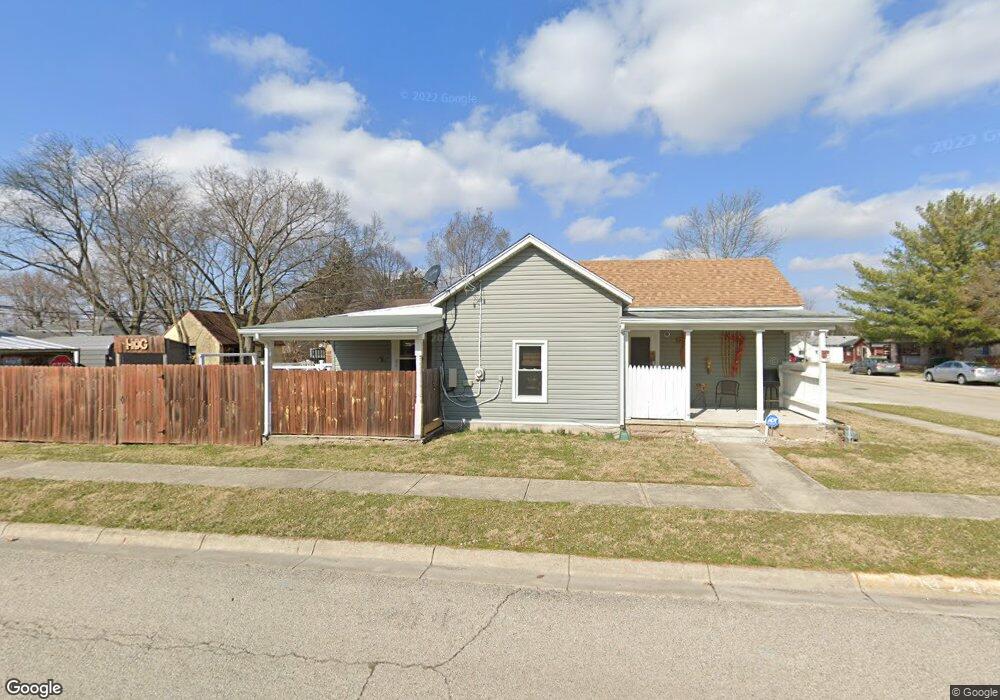
301 N Clay St New Carlisle, OH 45344
Estimated Value: $113,254 - $157,000
2
Beds
1
Bath
897
Sq Ft
$148/Sq Ft
Est. Value
About This Home
This home is located at 301 N Clay St, New Carlisle, OH 45344 and is currently estimated at $133,064, approximately $148 per square foot. 301 N Clay St is a home located in Clark County with nearby schools including New Carlisle Elementary School, Park Layne Elementary School, and Donnelsville Elementary School.
Ownership History
Date
Name
Owned For
Owner Type
Purchase Details
Closed on
Jun 26, 2015
Sold by
Porter Homer T
Bought by
Coulthard John W
Current Estimated Value
Home Financials for this Owner
Home Financials are based on the most recent Mortgage that was taken out on this home.
Original Mortgage
$22,610
Outstanding Balance
$8,753
Interest Rate
3.86%
Mortgage Type
Future Advance Clause Open End Mortgage
Estimated Equity
$124,311
Create a Home Valuation Report for This Property
The Home Valuation Report is an in-depth analysis detailing your home's value as well as a comparison with similar homes in the area
Home Values in the Area
Average Home Value in this Area
Purchase History
| Date | Buyer | Sale Price | Title Company |
|---|---|---|---|
| Coulthard John W | $27,000 | Attorney |
Source: Public Records
Mortgage History
| Date | Status | Borrower | Loan Amount |
|---|---|---|---|
| Open | Coulthard John W | $22,610 |
Source: Public Records
Tax History Compared to Growth
Tax History
| Year | Tax Paid | Tax Assessment Tax Assessment Total Assessment is a certain percentage of the fair market value that is determined by local assessors to be the total taxable value of land and additions on the property. | Land | Improvement |
|---|---|---|---|---|
| 2024 | $1,138 | $22,300 | $8,400 | $13,900 |
| 2023 | $1,138 | $22,300 | $8,400 | $13,900 |
| 2022 | $1,140 | $22,300 | $8,400 | $13,900 |
| 2021 | $1,103 | $19,090 | $7,120 | $11,970 |
| 2020 | $1,105 | $19,090 | $7,120 | $11,970 |
| 2019 | $1,095 | $18,600 | $7,120 | $11,480 |
| 2018 | $805 | $12,520 | $6,740 | $5,780 |
| 2017 | $750 | $12,513 | $6,738 | $5,775 |
| 2016 | $746 | $12,513 | $6,738 | $5,775 |
| 2015 | $303 | $12,755 | $6,738 | $6,017 |
| 2014 | $442 | $16,699 | $6,738 | $9,961 |
| 2013 | $443 | $16,699 | $6,738 | $9,961 |
Source: Public Records
Map
Nearby Homes
- 211 N Clay St
- 315 N Main St
- 210 Zimmerman St
- 419 Falcon Dr
- 202 Fenwick Dr
- 315 Fenwick Dr
- 906 N Scott St
- 805 Brookfield Dr
- 1204 N Scott St
- 201 Lightfoot Ct
- 203 Monroe Way
- 216 Lightfoot Ct
- 209 Lightfoot Ct
- 213 Lightfoot Ct
- 519 Brubaker Dr
- 1212 N Scott St
- 1206 N Scott St
- 1205 N Scott St
- 1209 N Scott St
- 1210 N Scott St