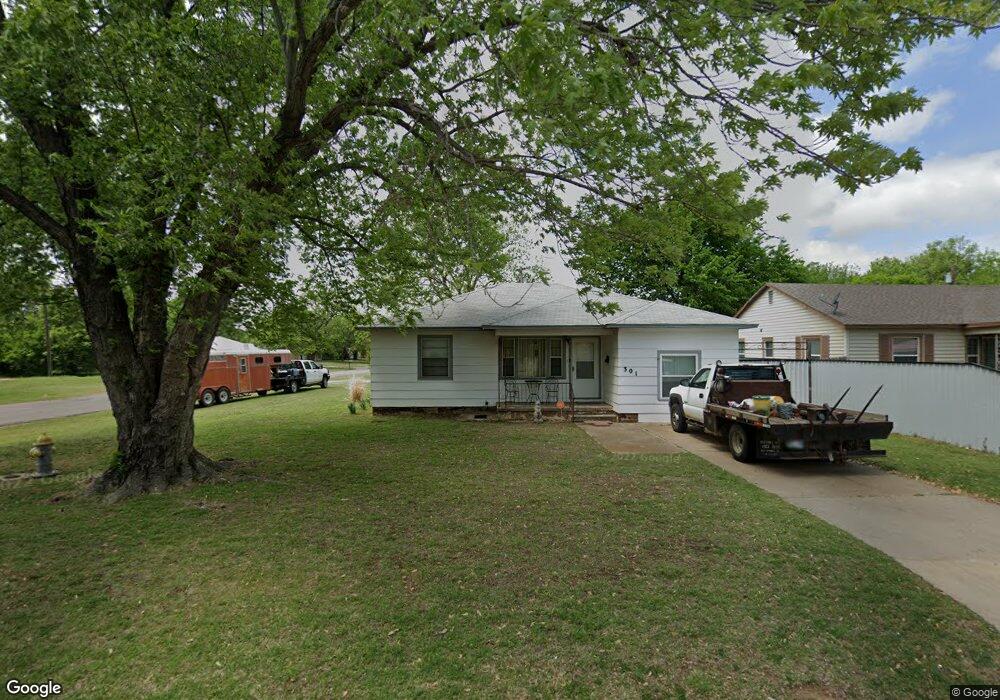
301 N F St Duncan, OK 73533
Estimated Value: $62,000 - $72,594
2
Beds
2
Baths
1,718
Sq Ft
$39/Sq Ft
Est. Value
About This Home
This home is located at 301 N F St, Duncan, OK 73533 and is currently estimated at $67,649, approximately $39 per square foot. 301 N F St is a home located in Stephens County with nearby schools including Woodrow Wilson Elementary School, Duncan Middle School, and Duncan High School.
Ownership History
Date
Name
Owned For
Owner Type
Purchase Details
Closed on
Apr 25, 2005
Sold by
Ridley Properties Ltd
Bought by
Hay Jimmy F and Hay Charlotte L
Current Estimated Value
Home Financials for this Owner
Home Financials are based on the most recent Mortgage that was taken out on this home.
Original Mortgage
$28,103
Interest Rate
5.89%
Mortgage Type
Purchase Money Mortgage
Purchase Details
Closed on
Jul 12, 2002
Sold by
Hay Jimmy F
Bought by
Hay Jimmy F
Create a Home Valuation Report for This Property
The Home Valuation Report is an in-depth analysis detailing your home's value as well as a comparison with similar homes in the area
Home Values in the Area
Average Home Value in this Area
Purchase History
| Date | Buyer | Sale Price | Title Company |
|---|---|---|---|
| Hay Jimmy F | $30,000 | None Available | |
| Hay Jimmy F | -- | -- |
Source: Public Records
Mortgage History
| Date | Status | Borrower | Loan Amount |
|---|---|---|---|
| Previous Owner | Hay Jimmy F | $28,103 |
Source: Public Records
Tax History Compared to Growth
Tax History
| Year | Tax Paid | Tax Assessment Tax Assessment Total Assessment is a certain percentage of the fair market value that is determined by local assessors to be the total taxable value of land and additions on the property. | Land | Improvement |
|---|---|---|---|---|
| 2025 | $240 | $3,935 | $309 | $3,626 |
| 2024 | $240 | $3,821 | $309 | $3,512 |
| 2023 | $240 | $3,821 | $309 | $3,512 |
| 2022 | $221 | $3,709 | $309 | $3,400 |
| 2021 | $221 | $3,601 | $309 | $3,292 |
| 2020 | $207 | $3,395 | $309 | $3,086 |
| 2019 | $199 | $3,296 | $309 | $2,987 |
| 2018 | $196 | $3,200 | $309 | $2,891 |
| 2017 | $200 | $3,333 | $309 | $3,024 |
| 2016 | $290 | $4,411 | $309 | $4,102 |
| 2015 | $256 | $4,283 | $309 | $3,974 |
| 2014 | $256 | $4,158 | $387 | $3,771 |
Source: Public Records
Map
Nearby Homes