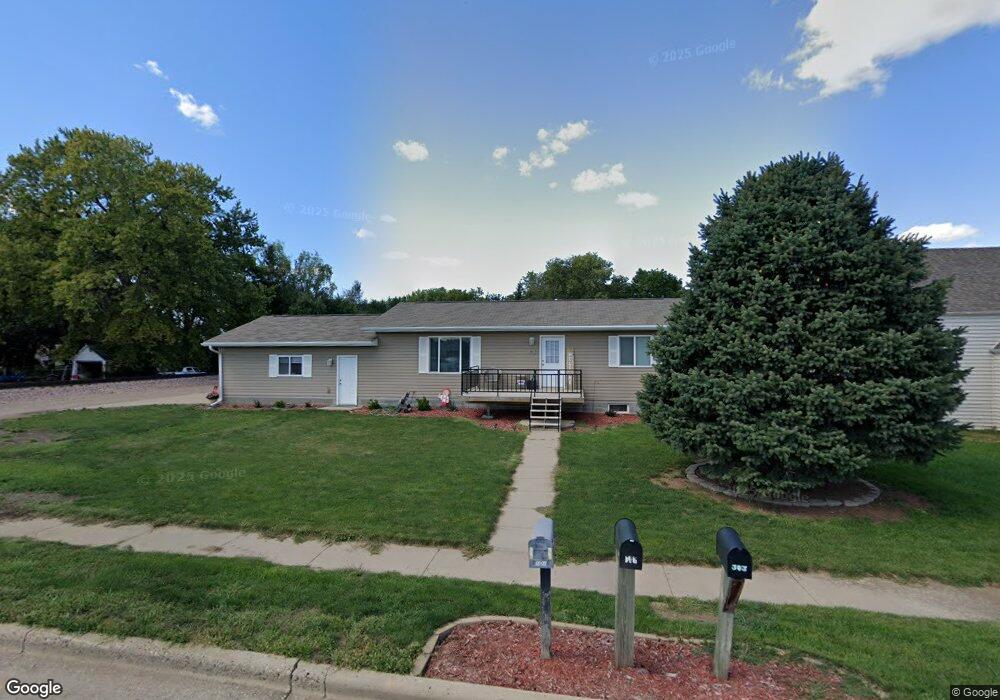
301 N Franklin St Elk Point, SD 57025
Estimated Value: $221,000 - $258,000
3
Beds
2
Baths
1,884
Sq Ft
$129/Sq Ft
Est. Value
About This Home
This home is located at 301 N Franklin St, Elk Point, SD 57025 and is currently estimated at $243,301, approximately $129 per square foot. 301 N Franklin St is a home located in Union County with nearby schools including Elk Point-Jefferson Elementary School, Elk Point-Jefferson Middle School, and Elk Point-Jefferson High School.
Ownership History
Date
Name
Owned For
Owner Type
Purchase Details
Closed on
Dec 30, 2019
Sold by
Kuhlmann Benjamin D and Goeden Julie
Bought by
Rasmussen Sammi Jo
Current Estimated Value
Home Financials for this Owner
Home Financials are based on the most recent Mortgage that was taken out on this home.
Original Mortgage
$134,747
Outstanding Balance
$118,799
Interest Rate
3.6%
Mortgage Type
New Conventional
Estimated Equity
$124,502
Purchase Details
Closed on
Feb 3, 2015
Sold by
Jpmorgan Chase Bank`
Bought by
Kuhlmann Benjamin D
Home Financials for this Owner
Home Financials are based on the most recent Mortgage that was taken out on this home.
Original Mortgage
$100,000
Interest Rate
3.82%
Mortgage Type
New Conventional
Create a Home Valuation Report for This Property
The Home Valuation Report is an in-depth analysis detailing your home's value as well as a comparison with similar homes in the area
Purchase History
| Date | Buyer | Sale Price | Title Company |
|---|---|---|---|
| Rasmussen Sammi Jo | $133,500 | None Available | |
| Kuhlmann Benjamin D | $98,000 | None Available |
Source: Public Records
Mortgage History
| Date | Status | Borrower | Loan Amount |
|---|---|---|---|
| Open | Rasmussen Sammi Jo | $134,747 | |
| Previous Owner | Kuhlmann Benjamin D | $100,000 |
Source: Public Records
Tax History
| Year | Tax Paid | Tax Assessment Tax Assessment Total Assessment is a certain percentage of the fair market value that is determined by local assessors to be the total taxable value of land and additions on the property. | Land | Improvement |
|---|---|---|---|---|
| 2025 | $2,818 | $181,510 | $24,780 | $156,730 |
| 2024 | $2,818 | $167,262 | $24,780 | $142,482 |
| 2023 | $2,986 | $167,262 | $24,780 | $142,482 |
| 2022 | $2,686 | $164,036 | $21,554 | $142,482 |
| 2021 | $2,749 | $142,640 | $18,743 | $123,897 |
| 2020 | $2,525 | $142,640 | $18,743 | $123,897 |
| 2019 | $2,362 | $135,847 | $17,850 | $117,997 |
| 2018 | $2,369 | $130,228 | $17,850 | $112,378 |
| 2017 | $2,398 | $130,228 | $0 | $130,228 |
| 2016 | $3,168 | $130,228 | $0 | $130,228 |
| 2015 | $3,168 | $130,228 | $17,850 | $112,378 |
| 2014 | $2,693 | $130,228 | $0 | $130,228 |
| 2013 | $2,584 | $124,878 | $0 | $124,878 |
| 2012 | $2,584 | $124,878 | $17,850 | $107,028 |
Source: Public Records
Map
Nearby Homes
- 304 S Douglas St
- 409 E Rose St
- 607 E Pleasant St
- 603 S Park Place
- 103 Maple Ct
- 903 E Main St
- 138 Green Court Dr
- 1207 Jack Nicklaus Dr
- 1105 Country Club Dr
- 1103 Country Club Dr
- 1206 Jack Nicklaus Dr
- TBD Country Club Dr
- 1107 Country Club Dr
- 1109 Country Club Dr
- 1108 Country Club Dr
- 1110 Country Club Dr
- 1202 Country Club Dr
- 1201 Country Club Dr
- 1207 Country Club Dr
- 1204 Country Club Dr
- 303 N Franklin St
- 209 W Twin St
- 207 W Twin St
- 211 N Franklin St
- 209 N Franklin St
- 207 N Franklin St
- 210 N Jackson St
- 210 N Franklin St
- 303 N Douglas St
- 108 W Rose St
- 211 N Jackson St
- 201 N Franklin St
- 205 W Pleasant St
- 204 N Franklin St
- 207 W Pleasant St
- 209 N Jackson St
- 209 W Pleasant St
- 109 W Pleasant St
- 207 N Douglas St
- 211 W Pleasant St
Your Personal Tour Guide
Ask me questions while you tour the home.