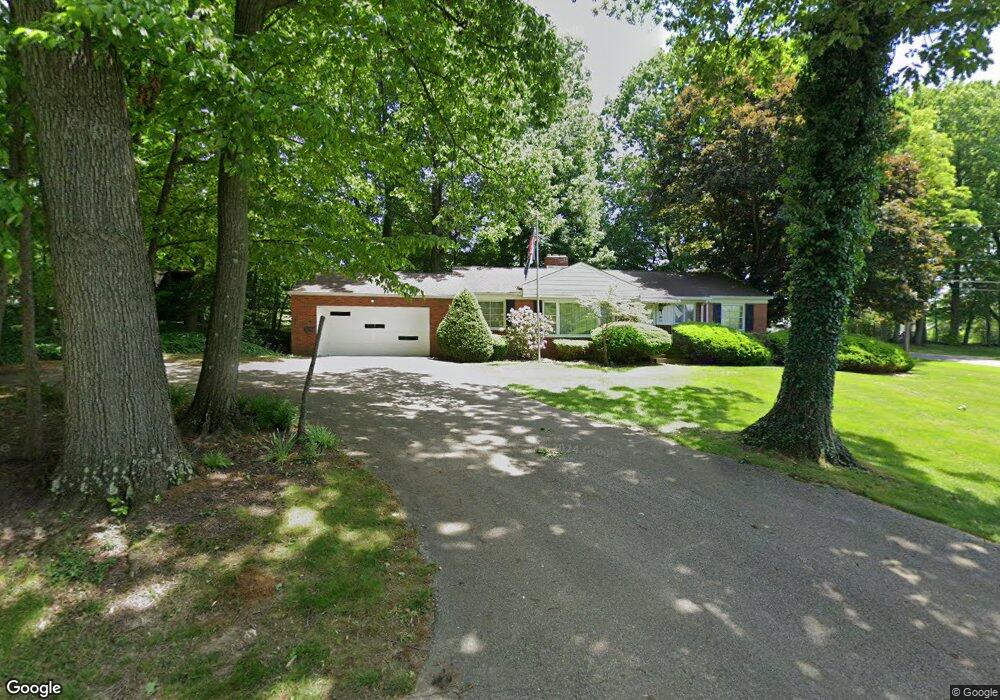
301 N Hillside Rd Canfield, OH 44406
Estimated Value: $221,000 - $242,000
3
Beds
2
Baths
1,300
Sq Ft
$177/Sq Ft
Est. Value
About This Home
This home is located at 301 N Hillside Rd, Canfield, OH 44406 and is currently estimated at $230,103, approximately $177 per square foot. 301 N Hillside Rd is a home located in Mahoning County with nearby schools including Canfield Village Middle School, Canfield High School, and St Charles Elementary School.
Ownership History
Date
Name
Owned For
Owner Type
Purchase Details
Closed on
May 18, 1971
Bought by
Clay Curtis B and Clay Sandra
Current Estimated Value
Create a Home Valuation Report for This Property
The Home Valuation Report is an in-depth analysis detailing your home's value as well as a comparison with similar homes in the area
Home Values in the Area
Average Home Value in this Area
Purchase History
| Date | Buyer | Sale Price | Title Company |
|---|---|---|---|
| Clay Curtis B | -- | -- |
Source: Public Records
Tax History Compared to Growth
Tax History
| Year | Tax Paid | Tax Assessment Tax Assessment Total Assessment is a certain percentage of the fair market value that is determined by local assessors to be the total taxable value of land and additions on the property. | Land | Improvement |
|---|---|---|---|---|
| 2024 | $2,391 | $65,260 | $12,860 | $52,400 |
| 2023 | $2,380 | $65,260 | $12,860 | $52,400 |
| 2022 | $1,736 | $41,290 | $11,130 | $30,160 |
| 2021 | $1,685 | $41,290 | $11,130 | $30,160 |
| 2020 | $1,692 | $41,290 | $11,130 | $30,160 |
| 2019 | $1,651 | $37,540 | $10,120 | $27,420 |
| 2018 | $1,631 | $37,540 | $10,120 | $27,420 |
| 2017 | $971 | $37,540 | $10,120 | $27,420 |
| 2016 | $1,576 | $37,150 | $10,120 | $27,030 |
| 2015 | $1,542 | $37,150 | $10,120 | $27,030 |
| 2014 | $1,548 | $37,150 | $10,120 | $27,030 |
| 2013 | $1,492 | $37,150 | $10,120 | $27,030 |
Source: Public Records
Map
Nearby Homes
- 301 Hilltop Blvd
- 321 Hilltop Blvd
- 58 Skyline Dr
- 125 Callahan Rd
- 120 Talsman Dr Unit 4
- 100 Talsman Dr
- 78 Neff Dr
- 38 Skyline Dr
- 201 Talsman Dr Unit 1
- 211 Talsman Dr Unit 1
- 419 Carriage Hill Dr
- 473 Carriage Hill Dr
- 6020 Century Blvd
- 6859 Fairground Blvd
- 395 N Broad St
- 227 Cross St
- 21 Villa Theresa Ln
- 31 Villa Theresa Ln
- 10 Villa Theresa Ln
- 20 Villa Theresa Ln
- 311 N Hillside Rd
- 300 Montridge Dr
- 310 Montridge Dr
- 370 Neff Dr
- 233 N Hillside Rd
- 320 Montridge Dr
- 321 N Hillside Rd
- 123 Skyline Dr
- 354 Neff Dr
- 230 N Hillside Rd
- 221 N Hillside Rd
- 311 Montridge Dr
- 330 Montridge Dr
- 119 Skyline Dr
- 331 N Hillside Rd
- 301 Montridge Dr
- 340 Neff Dr
- 345 Neff Dr
- 501 Neff Dr Unit 501
- 211 N Hillside Rd