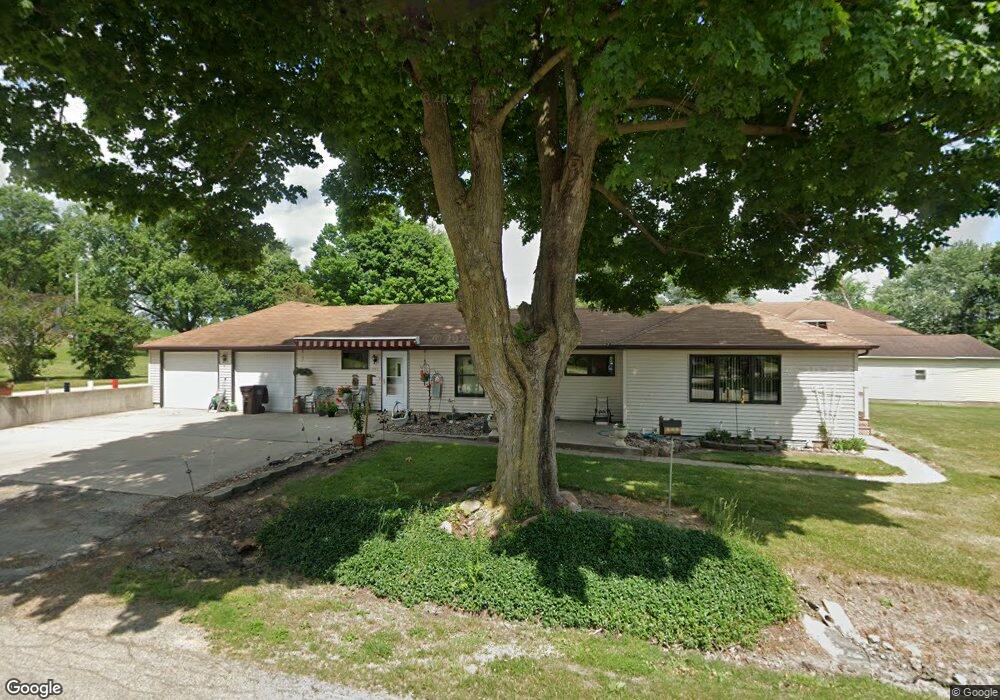
301 N Hulbert Rd Mc Connell, IL 61050
Estimated Value: $107,000 - $137,196
2
Beds
2
Baths
2,432
Sq Ft
$49/Sq Ft
Est. Value
About This Home
This home is located at 301 N Hulbert Rd, Mc Connell, IL 61050 and is currently estimated at $118,799, approximately $48 per square foot. 301 N Hulbert Rd is a home located in Stephenson County with nearby schools including Lena-Winslow Elementary School, Lena-Winslow Junior High School, and Lena-Winslow High School.
Ownership History
Date
Name
Owned For
Owner Type
Purchase Details
Closed on
Jul 21, 2005
Current Estimated Value
Create a Home Valuation Report for This Property
The Home Valuation Report is an in-depth analysis detailing your home's value as well as a comparison with similar homes in the area
Purchase History
| Date | Buyer | Sale Price | Title Company |
|---|---|---|---|
| -- | $53,000 | -- |
Source: Public Records
Tax History
| Year | Tax Paid | Tax Assessment Tax Assessment Total Assessment is a certain percentage of the fair market value that is determined by local assessors to be the total taxable value of land and additions on the property. | Land | Improvement |
|---|---|---|---|---|
| 2024 | $955 | $29,241 | $1,183 | $28,058 |
| 2023 | $1,082 | $28,917 | $1,170 | $27,747 |
| 2022 | $1,132 | $28,917 | $1,170 | $27,747 |
| 2021 | $1,133 | $26,764 | $1,135 | $25,629 |
| 2020 | $1,160 | $26,764 | $1,135 | $25,629 |
| 2019 | $1,171 | $26,239 | $1,113 | $25,126 |
| 2018 | $1,185 | $25,537 | $1,083 | $24,454 |
| 2017 | $1,197 | $25,076 | $1,083 | $23,993 |
| 2016 | $1,188 | $25,076 | $1,083 | $23,993 |
| 2015 | $1,203 | $24,827 | $1,072 | $23,755 |
| 2013 | $1,220 | $26,683 | $1,186 | $25,497 |
Source: Public Records
Map
Nearby Homes
- TBD W Mcconnell Rd
- TBD N Flansburg Rd
- 000 W Beaver Rd
- 0 N Bellview Rd Unit 202507343
- TBD Illinois Route 26
- 2472 W Red Oak Rd
- 201 S Church St
- 514 Wolf Hollow Dr
- 510 Wolf Hollow Dr
- 515 Wolf Hollow Dr Unit or 415 Oak Ridge Dr
- 411 Oak Ridge Dr
- 506 Wolf Hollow Dr
- 416 Oak Ridge Dr Unit or 509 Wolf Hollow D
- 9623 Deerfield Ln
- 403 Oak Ridge Dr
- 505 Wolf Hollow Dr
- 215 Oak Terrace Ct Unit or 326 Valley View D
- 501 Wolf Hollow Dr
- 213 Oak Terrace Ct
- 412 Oak Ridge Dr
- 110 E Elm St
- 104 W Olive St
- 101 E Maple St
- 108 W Olive St
- 105 E Maple St
- 109 E Maple St
- 107 W Olive St
- 115 E Maple St
- 116 W Olive St
- 105 W Conaty St
- 111 W Olive St
- 113 W Conaty St
- 120 W Olive St
- 101 W Conaty St
- 205 N Hulbert Rd
- 117 W Conaty St
- 115 W Olive St
- 124 W Olive St
- 110 E Maple St
- 106 W Grove
Your Personal Tour Guide
Ask me questions while you tour the home.