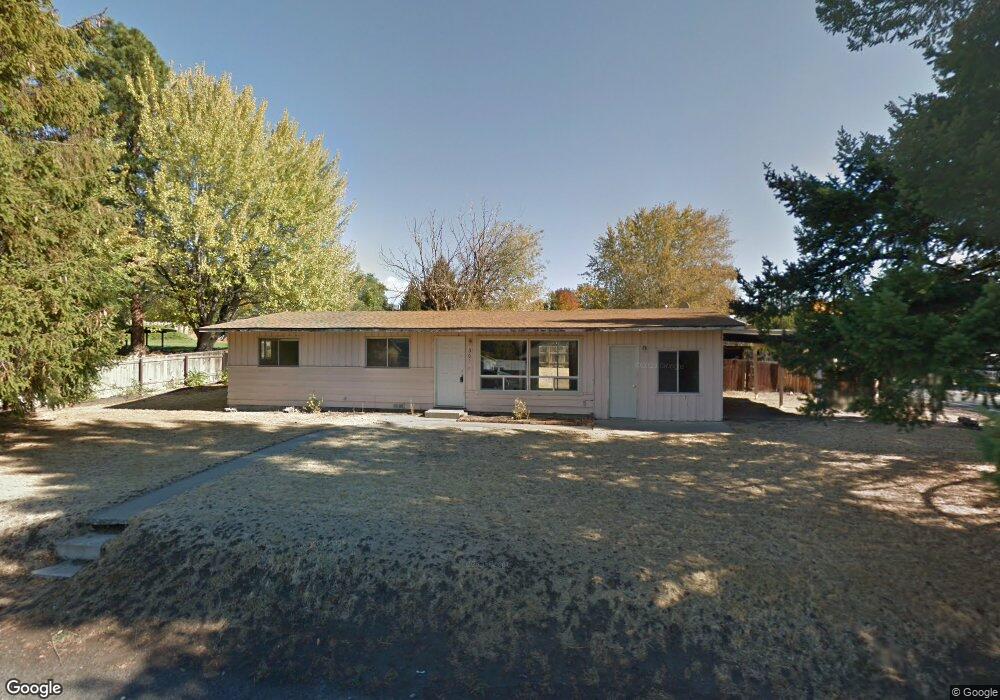
301 N James Ave East Wenatchee, WA 98802
Estimated Value: $305,000 - $482,000
3
Beds
1
Bath
1,200
Sq Ft
$332/Sq Ft
Est. Value
About This Home
This home is located at 301 N James Ave, East Wenatchee, WA 98802 and is currently estimated at $398,461, approximately $332 per square foot. 301 N James Ave is a home located in Douglas County with nearby schools including Kenroy Elementary School, Clovis Point Intermediate School, and Eastmont Junior High School.
Ownership History
Date
Name
Owned For
Owner Type
Purchase Details
Closed on
Nov 9, 2012
Sold by
Secretary Of Housing & Urban Development
Bought by
Madsen Partee Sean
Current Estimated Value
Home Financials for this Owner
Home Financials are based on the most recent Mortgage that was taken out on this home.
Original Mortgage
$90,178
Interest Rate
3.62%
Mortgage Type
FHA
Purchase Details
Closed on
Aug 21, 2012
Sold by
Us Bank National Association
Bought by
Secretary Of Housing & Urban Development
Purchase Details
Closed on
Dec 22, 2011
Sold by
Hollenbeck Vickie and Keifer Shelby M
Bought by
Us Bank National Association
Purchase Details
Closed on
Nov 18, 2009
Sold by
Crest Julie D
Bought by
Hollenbeck Vickie and Keifer Shelby
Home Financials for this Owner
Home Financials are based on the most recent Mortgage that was taken out on this home.
Original Mortgage
$148,265
Interest Rate
4.88%
Mortgage Type
FHA
Create a Home Valuation Report for This Property
The Home Valuation Report is an in-depth analysis detailing your home's value as well as a comparison with similar homes in the area
Home Values in the Area
Average Home Value in this Area
Purchase History
| Date | Buyer | Sale Price | Title Company |
|---|---|---|---|
| Madsen Partee Sean | -- | None Available | |
| Secretary Of Housing & Urban Development | -- | First American Title Ins Co | |
| Us Bank National Association | $160,019 | Accommodation | |
| Hollenbeck Vickie | $175,673 | North Meridian Title & Escro |
Source: Public Records
Mortgage History
| Date | Status | Borrower | Loan Amount |
|---|---|---|---|
| Open | Madsen Partee Sean | $25,000 | |
| Previous Owner | Madsen Partee Sean | $90,178 | |
| Previous Owner | Hollenbeck Vickie | $148,265 |
Source: Public Records
Tax History Compared to Growth
Tax History
| Year | Tax Paid | Tax Assessment Tax Assessment Total Assessment is a certain percentage of the fair market value that is determined by local assessors to be the total taxable value of land and additions on the property. | Land | Improvement |
|---|---|---|---|---|
| 2025 | $400 | $280,400 | $100,000 | $180,400 |
| 2024 | $2,616 | $259,800 | $100,000 | $159,800 |
| 2023 | $2,749 | $239,600 | $100,000 | $139,600 |
| 2022 | $2,622 | $219,600 | $80,000 | $139,600 |
| 2021 | $2,680 | $219,600 | $80,000 | $139,600 |
| 2020 | $2,619 | $208,500 | $72,000 | $136,500 |
| 2018 | $2,322 | $179,500 | $60,000 | $119,500 |
| 2017 | $1,846 | $179,500 | $60,000 | $119,500 |
| 2016 | $1,578 | $152,100 | $60,000 | $92,100 |
| 2015 | $1,541 | $141,500 | $60,000 | $81,500 |
| 2014 | -- | $132,400 | $60,000 | $72,400 |
| 2013 | -- | $130,300 | $60,000 | $70,300 |
Source: Public Records
Map
Nearby Homes
- 128 N June Ave
- 475 N Kansas Ave
- 322 N Kentucky Ave Unit A&B
- 1598 Tedford St SE
- 772 N Keller Ave
- 646 N Gale Place
- 182 S Keller Ave
- 17 S Lombard Ave
- 800 N Kentucky Ave
- 1718 8th St NE
- 211 S Pace Dr Unit 30
- 902 N Kenroy Terrace
- 1981 Grant Rd
- 1810 9th St NE
- 369 S Kentucky Ave
- 1102 Carolyn St
- 544 N Colorado Ave
- 561 Morning View Ave
- 39 Mandolin Ave
- 1055 N Jackson Ave
- 1243 3rd St NE
- 313 N James Ave
- 306 N James Ave
- 287 N James Ave
- 1250 3rd St NE
- 314 N James Ave
- 1265 3rd St NE
- 1269 3rd St NE
- 1267 3rd St NE
- 284 N James Ave
- 1258 3rd St NE
- 1161 3rd St NE
- 285 N James Ave
- 282 N James Ave
- 1167 3rd St NE
- 310 N Joseph Ave
- 326 N James Ave
- 330 N Joseph Ave
- 292 N Joseph Ave
- 312 N Joseph Ave