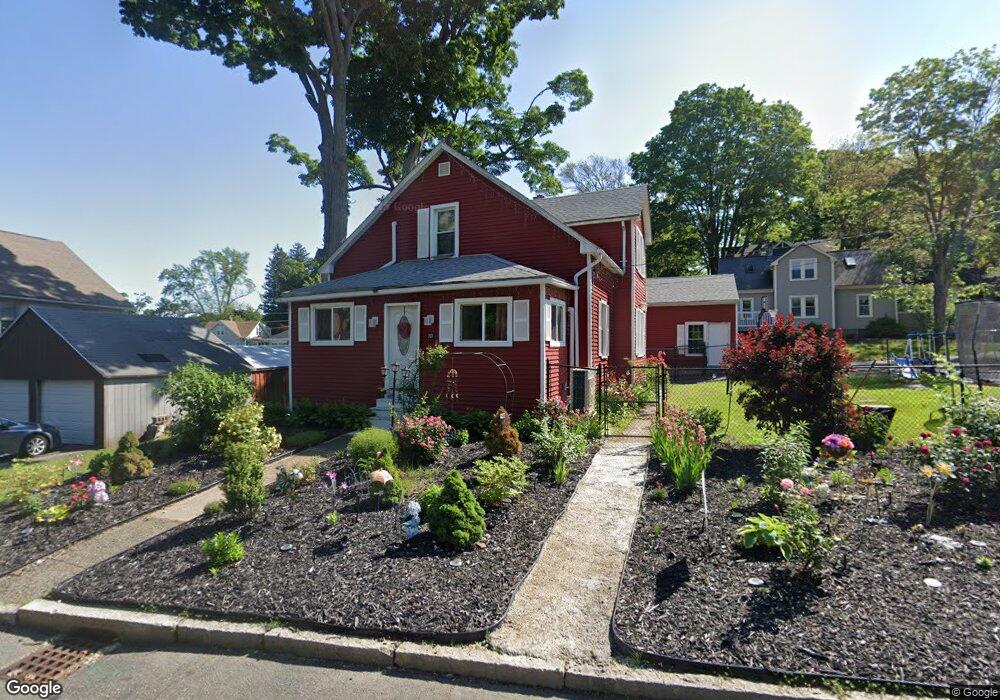
301 N Main St East Longmeadow, MA 01028
Estimated Value: $233,000 - $373,000
3
Beds
1
Bath
1,631
Sq Ft
$191/Sq Ft
Est. Value
About This Home
This home is located at 301 N Main St, East Longmeadow, MA 01028 and is currently estimated at $311,310, approximately $190 per square foot. 301 N Main St is a home located in Hampden County with nearby schools including Meadowbrook Elementary School, Birchland Park Middle School, and East Longmeadow High School.
Ownership History
Date
Name
Owned For
Owner Type
Purchase Details
Closed on
Apr 9, 2019
Sold by
Graham Bruce F
Bought by
Alberto Aurelio R
Current Estimated Value
Home Financials for this Owner
Home Financials are based on the most recent Mortgage that was taken out on this home.
Original Mortgage
$120,000
Outstanding Balance
$105,501
Interest Rate
4.3%
Mortgage Type
New Conventional
Estimated Equity
$205,809
Purchase Details
Closed on
Feb 25, 2019
Sold by
Graham Bruce F and Graham Patricia K
Bought by
Graham Bruce F
Home Financials for this Owner
Home Financials are based on the most recent Mortgage that was taken out on this home.
Original Mortgage
$120,000
Outstanding Balance
$105,501
Interest Rate
4.3%
Mortgage Type
New Conventional
Estimated Equity
$205,809
Purchase Details
Closed on
Nov 30, 2009
Sold by
Graham Bruce F and Branchini Robert R
Bought by
Graham Bruce F and Graham Patricia K
Create a Home Valuation Report for This Property
The Home Valuation Report is an in-depth analysis detailing your home's value as well as a comparison with similar homes in the area
Home Values in the Area
Average Home Value in this Area
Purchase History
| Date | Buyer | Sale Price | Title Company |
|---|---|---|---|
| Alberto Aurelio R | $141,000 | -- | |
| Graham Bruce F | -- | -- | |
| Graham Bruce F | -- | -- |
Source: Public Records
Mortgage History
| Date | Status | Borrower | Loan Amount |
|---|---|---|---|
| Open | Alberto Aurelio R | $120,000 |
Source: Public Records
Tax History Compared to Growth
Tax History
| Year | Tax Paid | Tax Assessment Tax Assessment Total Assessment is a certain percentage of the fair market value that is determined by local assessors to be the total taxable value of land and additions on the property. | Land | Improvement |
|---|---|---|---|---|
| 2025 | $4,722 | $255,500 | $99,600 | $155,900 |
| 2024 | $4,509 | $243,200 | $99,600 | $143,600 |
| 2023 | $4,259 | $221,800 | $90,500 | $131,300 |
| 2022 | $4,011 | $197,700 | $82,200 | $115,500 |
| 2021 | $3,934 | $186,800 | $76,200 | $110,600 |
| 2020 | $3,766 | $180,700 | $76,200 | $104,500 |
| 2019 | $3,619 | $176,100 | $74,000 | $102,100 |
| 2018 | $3,551 | $169,600 | $74,000 | $95,600 |
| 2017 | $3,458 | $166,500 | $72,400 | $94,100 |
| 2016 | $3,443 | $163,000 | $70,200 | $92,800 |
| 2015 | $3,377 | $163,000 | $70,200 | $92,800 |
Source: Public Records
Map
Nearby Homes