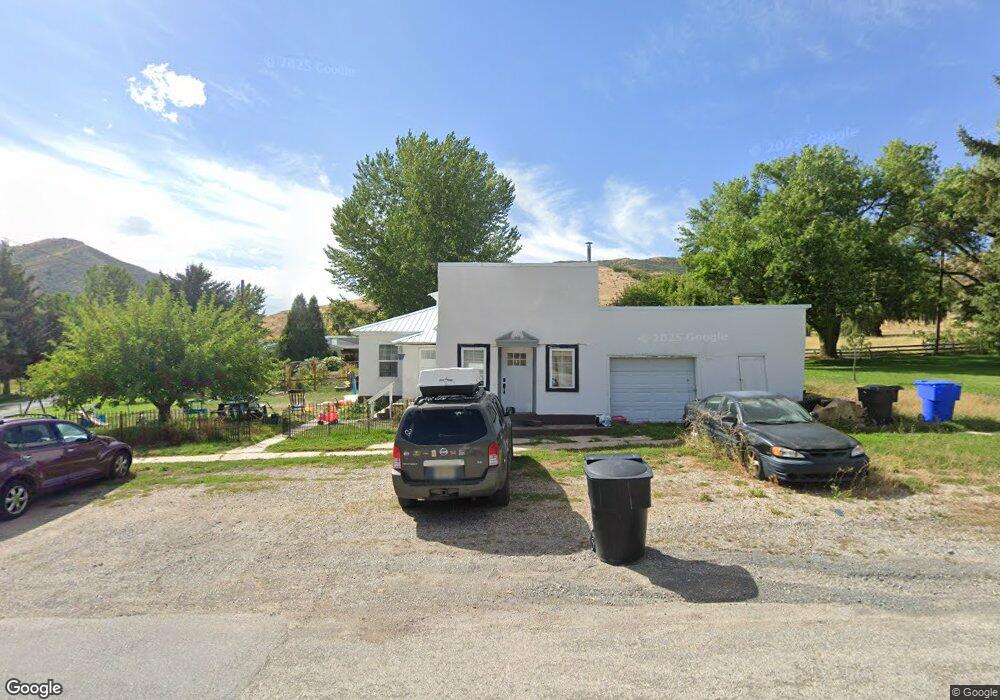
301 N Main St Mantua, UT 84324
Estimated Value: $377,000 - $426,000
4
Beds
1
Bath
1,779
Sq Ft
$226/Sq Ft
Est. Value
About This Home
This home is located at 301 N Main St, Mantua, UT 84324 and is currently estimated at $402,760, approximately $226 per square foot. 301 N Main St is a home located in Box Elder County with nearby schools including Golden Spike Elementary, Box Elder Middle School, and Adele C. Young Intermediate School.
Ownership History
Date
Name
Owned For
Owner Type
Purchase Details
Closed on
Jan 17, 2023
Sold by
Keane Nathaniel Joseph
Bought by
Keane Nathaniel Joseph and Keane Abigail Grace
Current Estimated Value
Home Financials for this Owner
Home Financials are based on the most recent Mortgage that was taken out on this home.
Original Mortgage
$213,400
Outstanding Balance
$206,394
Interest Rate
6.27%
Mortgage Type
New Conventional
Estimated Equity
$196,366
Purchase Details
Closed on
Nov 3, 2021
Sold by
Johnson Rebecca and Baron Rebecca J
Bought by
Bowler Maigan
Home Financials for this Owner
Home Financials are based on the most recent Mortgage that was taken out on this home.
Original Mortgage
$185,000
Interest Rate
2.88%
Mortgage Type
New Conventional
Purchase Details
Closed on
Aug 7, 2014
Sold by
Baron Gary
Bought by
Baron Rebecca J
Create a Home Valuation Report for This Property
The Home Valuation Report is an in-depth analysis detailing your home's value as well as a comparison with similar homes in the area
Home Values in the Area
Average Home Value in this Area
Purchase History
| Date | Buyer | Sale Price | Title Company |
|---|---|---|---|
| Keane Nathaniel Joseph | -- | Novation Title | |
| Bowler Maigan | -- | Phillips Hansen Land Ttl Co | |
| Baron Rebecca J | -- | None Available |
Source: Public Records
Mortgage History
| Date | Status | Borrower | Loan Amount |
|---|---|---|---|
| Open | Keane Nathaniel Joseph | $213,400 | |
| Previous Owner | Bowler Maigan | $185,000 |
Source: Public Records
Tax History Compared to Growth
Tax History
| Year | Tax Paid | Tax Assessment Tax Assessment Total Assessment is a certain percentage of the fair market value that is determined by local assessors to be the total taxable value of land and additions on the property. | Land | Improvement |
|---|---|---|---|---|
| 2025 | $1,819 | $364,194 | $212,800 | $151,394 |
| 2024 | $1,819 | $339,507 | $187,800 | $151,707 |
| 2023 | $1,218 | $376,223 | $187,800 | $188,423 |
| 2022 | $1,351 | $128,673 | $52,140 | $76,533 |
| 2021 | $1,449 | $195,483 | $94,800 | $100,683 |
| 2020 | $1,361 | $195,483 | $94,800 | $100,683 |
| 2019 | $1,330 | $101,145 | $52,140 | $49,005 |
| 2018 | $698 | $50,266 | $28,908 | $21,358 |
| 2017 | $718 | $91,393 | $28,908 | $38,833 |
| 2016 | $724 | $49,249 | $28,908 | $20,341 |
| 2015 | $697 | $47,400 | $28,908 | $18,492 |
| 2014 | $697 | $46,520 | $28,908 | $17,612 |
| 2013 | -- | $46,520 | $15,180 | $31,340 |
Source: Public Records
Map
Nearby Homes
- 115 S Main St
- 91 U S 89
- 263 E Fish Hatchery Rd
- 270 E Mountain View Dr Unit 59
- 588 S 100 E
- 159 E 625 S
- 640 S 100 E
- 655 Willard Peak Rd
- 1705 Willard Peak Rd Unit 2
- 1623 Willard Peak Rd Unit 1
- 1329 E Kaylynne Cir
- 64 N Bywater Way
- 150 N Marie Dr Unit 42
- 1228 Sheri Cir
- 192 N Highland Blvd
- 1066 Beecher Ave
- 1048 Elm Ave
- 504 Aspen Dr
- 1023 E 200 N
- 510 Aspen Dr