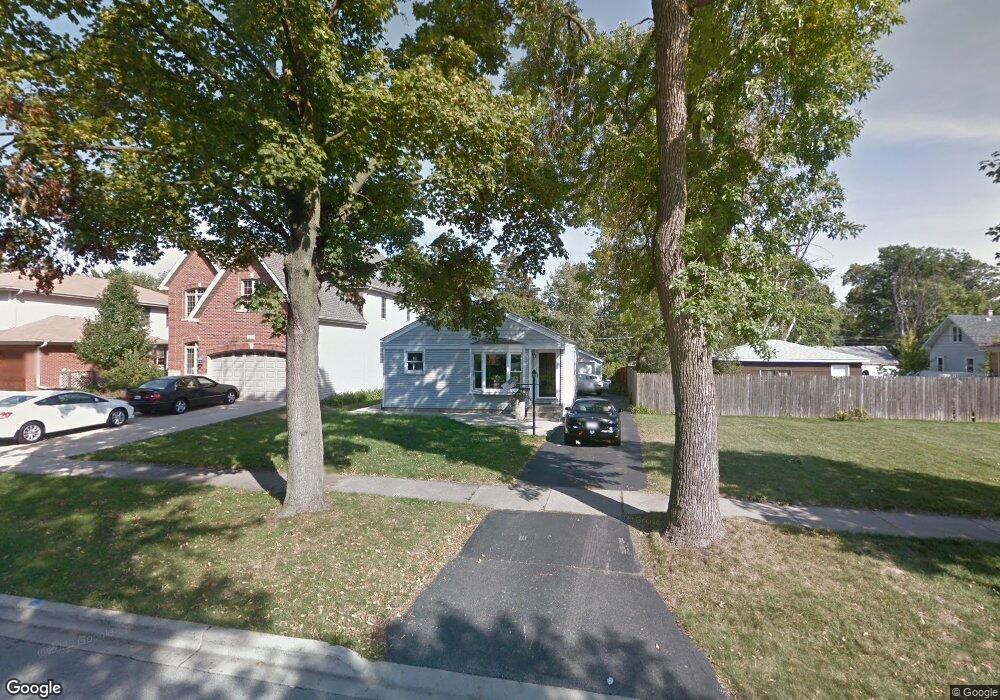
301 N Walnut St Elmhurst, IL 60126
Estimated Value: $386,000 - $422,000
Studio
--
Bath
898
Sq Ft
$450/Sq Ft
Est. Value
About This Home
This home is located at 301 N Walnut St, Elmhurst, IL 60126 and is currently estimated at $404,333, approximately $450 per square foot. 301 N Walnut St is a home located in DuPage County with nearby schools including Emerson Elementary School, Churchville Middle School, and York Community High School.
Ownership History
Date
Name
Owned For
Owner Type
Purchase Details
Closed on
May 6, 2003
Sold by
Splitt Carol M and Barone Carol M
Bought by
Barone Carol M
Current Estimated Value
Home Financials for this Owner
Home Financials are based on the most recent Mortgage that was taken out on this home.
Original Mortgage
$56,700
Interest Rate
5.51%
Mortgage Type
Purchase Money Mortgage
Purchase Details
Closed on
Feb 27, 2003
Sold by
Splitt Mark I
Bought by
Splitt Carol M
Purchase Details
Closed on
Dec 4, 1998
Sold by
Arms Carol M and Splitt Carol M
Bought by
Splitt Mark I and Splitt Carol M
Home Financials for this Owner
Home Financials are based on the most recent Mortgage that was taken out on this home.
Original Mortgage
$75,200
Interest Rate
6.96%
Create a Home Valuation Report for This Property
The Home Valuation Report is an in-depth analysis detailing your home's value as well as a comparison with similar homes in the area
Home Values in the Area
Average Home Value in this Area
Purchase History
| Date | Buyer | Sale Price | Title Company |
|---|---|---|---|
| Barone Carol M | -- | Rts | |
| Splitt Carol M | -- | Chicago Title Insurance Co | |
| Splitt Mark I | -- | First American Title |
Source: Public Records
Mortgage History
| Date | Status | Borrower | Loan Amount |
|---|---|---|---|
| Closed | Barone Carol M | $56,700 | |
| Closed | Splitt Mark I | $75,200 |
Source: Public Records
Tax History
| Year | Tax Paid | Tax Assessment Tax Assessment Total Assessment is a certain percentage of the fair market value that is determined by local assessors to be the total taxable value of land and additions on the property. | Land | Improvement |
|---|---|---|---|---|
| 2024 | $6,132 | $108,127 | $63,734 | $44,393 |
| 2023 | $5,641 | $99,400 | $58,590 | $40,810 |
| 2022 | $5,453 | $95,020 | $56,060 | $38,960 |
| 2021 | $5,215 | $91,020 | $53,700 | $37,320 |
| 2020 | $4,901 | $87,190 | $51,440 | $35,750 |
| 2019 | $4,846 | $83,830 | $49,460 | $34,370 |
| 2018 | $4,531 | $78,350 | $47,100 | $31,250 |
| 2017 | $4,437 | $74,890 | $45,020 | $29,870 |
| 2016 | $4,239 | $69,150 | $41,570 | $27,580 |
| 2015 | $4,142 | $63,880 | $38,400 | $25,480 |
| 2014 | $3,636 | $52,700 | $31,680 | $21,020 |
| 2013 | $3,626 | $53,780 | $32,330 | $21,450 |
Source: Public Records
Map
Nearby Homes
- 275 W North Ave
- 365 N Walnut St
- 367 N Oak St
- 370 N Oak St
- 374 N Myrtle Ave
- 322 N Highland Ave
- 284 N Highland Ave
- 270 W Fremont Ave
- 196 N Walnut St
- 413 N Ridgeland Ave
- 461 W Grantley Ave
- 147 N Myrtle Ave
- 146 N Walnut St
- 432 N Ridgeland Ave
- 456 N Elm Ave
- 258 N Addison Ave
- 260 N Addison Ave
- 254 N Addison Ave
- 256 N Addison Ave
- 332 N West Ave
- 311 N Walnut St
- 315 W North Ave
- 291 N Walnut St
- 313 N Walnut St
- 313 W North Ave
- 315 N Walnut St
- 302 N Walnut St
- 298 N Walnut St
- 294 N Walnut St
- 296 N Myrtle Ave
- 292 N Myrtle Ave
- 304 N Walnut St
- 300 N Myrtle Ave
- 317 N Walnut St
- 329 W North Ave
- 308 N Walnut St
- 304 N Myrtle Ave
- 312 W North Ave
- 286 N Myrtle Ave
- 312 N Walnut St
Your Personal Tour Guide
Ask me questions while you tour the home.