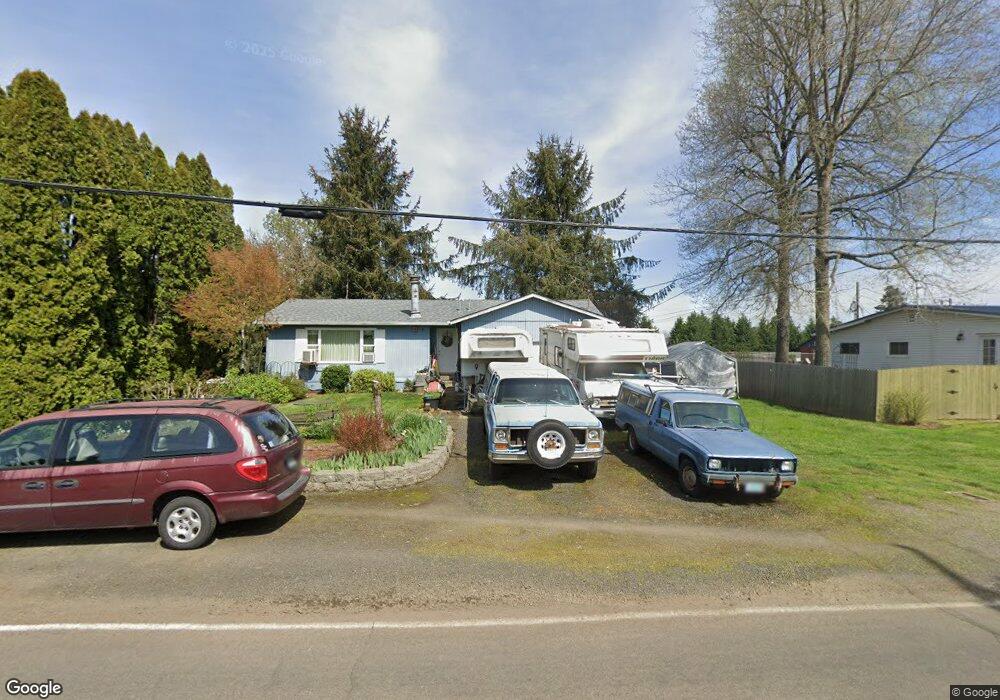
301 NE South Nebergall Loop Albany, OR 97321
North Albany NeighborhoodEstimated Value: $541,000 - $686,000
5
Beds
2
Baths
1,304
Sq Ft
$465/Sq Ft
Est. Value
About This Home
This home is located at 301 NE South Nebergall Loop, Albany, OR 97321 and is currently estimated at $605,920, approximately $464 per square foot. 301 NE South Nebergall Loop is a home located in Benton County with nearby schools including North Albany Elementary School, North Albany Middle School, and West Albany High School.
Ownership History
Date
Name
Owned For
Owner Type
Purchase Details
Closed on
Feb 7, 2022
Sold by
Bowder Dale E
Bought by
Bowder Dale and Bowder Kathleen Patricia
Current Estimated Value
Home Financials for this Owner
Home Financials are based on the most recent Mortgage that was taken out on this home.
Original Mortgage
$185,100
Outstanding Balance
$147,606
Interest Rate
3.55%
Mortgage Type
New Conventional
Estimated Equity
$458,314
Purchase Details
Closed on
Mar 23, 2005
Sold by
Bowder Kathleen P
Bought by
Bowder Dale E
Home Financials for this Owner
Home Financials are based on the most recent Mortgage that was taken out on this home.
Original Mortgage
$182,400
Interest Rate
5.53%
Mortgage Type
New Conventional
Purchase Details
Closed on
Aug 2, 2003
Sold by
Mitchell Roger L and Mitchell Jaynie C
Bought by
Bowder Dale E and Bowder Kathleen P
Purchase Details
Closed on
Jul 24, 2003
Sold by
Us Bank Na
Bought by
Mitchell Roger L and Mitchell Jaynie D
Create a Home Valuation Report for This Property
The Home Valuation Report is an in-depth analysis detailing your home's value as well as a comparison with similar homes in the area
Home Values in the Area
Average Home Value in this Area
Purchase History
| Date | Buyer | Sale Price | Title Company |
|---|---|---|---|
| Bowder Dale | -- | Ticor Title | |
| Bowder Dale E | -- | Lawyers Title Ins | |
| Bowder Dale E | $182,500 | Lawyers Title Insurance Corp | |
| Mitchell Roger L | -- | First American Title |
Source: Public Records
Mortgage History
| Date | Status | Borrower | Loan Amount |
|---|---|---|---|
| Open | Bowder Dale | $185,100 | |
| Previous Owner | Bowder Dale E | $182,400 |
Source: Public Records
Tax History Compared to Growth
Tax History
| Year | Tax Paid | Tax Assessment Tax Assessment Total Assessment is a certain percentage of the fair market value that is determined by local assessors to be the total taxable value of land and additions on the property. | Land | Improvement |
|---|---|---|---|---|
| 2025 | $5,100 | $279,174 | -- | -- |
| 2024 | $5,100 | $271,043 | -- | -- |
| 2023 | $4,806 | $263,149 | $0 | $0 |
| 2022 | $4,734 | $255,484 | $0 | $0 |
| 2021 | $4,483 | $248,043 | $0 | $0 |
| 2020 | $4,537 | $240,818 | $0 | $0 |
| 2019 | $4,281 | $233,804 | $0 | $0 |
| 2018 | $4,300 | $226,994 | $0 | $0 |
| 2017 | $4,175 | $220,383 | $0 | $0 |
| 2016 | $3,801 | $213,964 | $0 | $0 |
| 2015 | $3,753 | $207,732 | $0 | $0 |
| 2014 | $3,671 | $201,682 | $0 | $0 |
| 2012 | -- | $190,105 | $0 | $0 |
Source: Public Records
Map
Nearby Homes
- 1221 NE Montgomery Place
- 334 NE 13th Ave
- 1141 NE Springwood Dr
- 153 NE Peachtree Ln
- 580 NW Quarry Rd
- 112 NE Green Ct
- 1791 NW Horseshoe Lake Cir
- 645 NW East Thornton Lake Dr
- 653 NW East Thornton Lake Dr
- 885 N Pointe Dr NW
- 1440 NW Laurel Heights Dr
- 1904 NW Eagles Ridge Ln
- 910 Troon St NW
- 1591 Kallie Place NW
- 1450 N Albany Rd NW
- 443 Geri St NW
- 306 Pine St SE
- 1227 NE Water Ave
- 2310 Gale St NW
- 2029 NW 20th Loop
- 313 NE South Nebergall Loop
- 313 NE South Nebergall Loop
- 1607 NW Springhill Dr
- 1615 NW Springhill Dr
- 317 NE South Nebergall Loop
- 1643 NW Springhill Dr
- 1647 Springhill Dr NE
- 308 NE South Nebergall Loop
- 1630 NW Springhill Dr
- 1638 NW Springhill Dr
- 349 NE South Nebergall Loop
- 1540 NW Springhill Dr
- 1530 NW Springhill Dr
- 115 NW Quarry Rd
- 1650 NW Springhill Dr
- 369 NE South Nebergall Loop
- 155 NW Parker Place
- 150 NW Parker Place
- 1520 NW Springhill Dr
- 1651 Springhill Dr NE