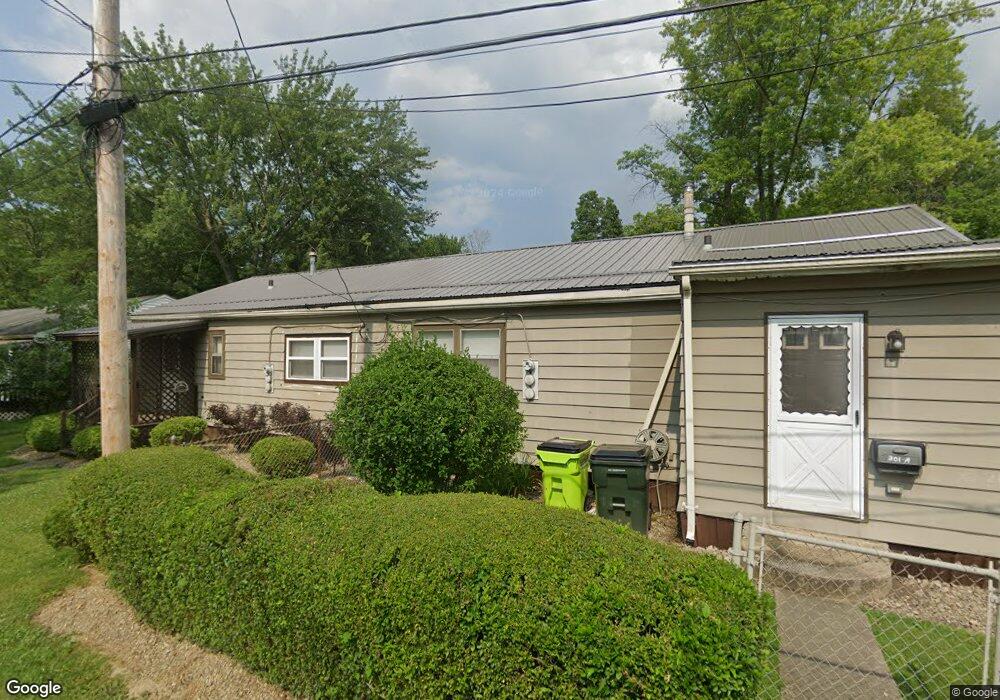
301 Newton Dr Newton Falls, OH 44444
Estimated Value: $87,000 - $104,585
4
Beds
2
Baths
1,500
Sq Ft
$66/Sq Ft
Est. Value
About This Home
This home is located at 301 Newton Dr, Newton Falls, OH 44444 and is currently estimated at $98,896, approximately $65 per square foot. 301 Newton Dr is a home located in Trumbull County with nearby schools including Newton Falls Middle School, Newton Falls Junior High School, and Newton Falls High School.
Ownership History
Date
Name
Owned For
Owner Type
Purchase Details
Closed on
Oct 4, 2022
Sold by
Biffle Stefan
Bought by
Sea Suff Investments Llc
Current Estimated Value
Purchase Details
Closed on
Mar 5, 2021
Sold by
Cordero Dianna M
Bought by
Riffle Stefan
Purchase Details
Closed on
Oct 5, 2018
Sold by
Cordero Paige A
Bought by
Cordero Diana M
Purchase Details
Closed on
Dec 10, 2012
Sold by
Wilfong Leroy L
Bought by
Cordero Paige A
Purchase Details
Closed on
Aug 24, 2010
Sold by
Matzek Jaime E
Bought by
Wilfong Leroy L
Purchase Details
Closed on
Mar 16, 2010
Sold by
Ryan Victoria L and Ryan Wilfred
Bought by
Matzek Jaime E
Purchase Details
Closed on
Jun 25, 2001
Sold by
Brazin Charles P
Bought by
Brazin Charles P
Purchase Details
Closed on
Jan 1, 1990
Bought by
Charles P Brazin
Create a Home Valuation Report for This Property
The Home Valuation Report is an in-depth analysis detailing your home's value as well as a comparison with similar homes in the area
Home Values in the Area
Average Home Value in this Area
Purchase History
| Date | Buyer | Sale Price | Title Company |
|---|---|---|---|
| Sea Suff Investments Llc | $28,500 | -- | |
| Riffle Stefan | $10,600 | None Available | |
| Cordero Diana M | -- | None Available | |
| Cordero Paige A | -- | None Available | |
| Wilfong Leroy L | $2,000 | None Available | |
| Matzek Jaime E | $2,500 | None Available | |
| Brazin Charles P | -- | -- | |
| Charles P Brazin | -- | -- |
Source: Public Records
Tax History Compared to Growth
Tax History
| Year | Tax Paid | Tax Assessment Tax Assessment Total Assessment is a certain percentage of the fair market value that is determined by local assessors to be the total taxable value of land and additions on the property. | Land | Improvement |
|---|---|---|---|---|
| 2024 | $622 | $24,120 | $1,260 | $22,860 |
| 2023 | $973 | $10,570 | $1,260 | $9,310 |
| 2022 | $342 | $6,660 | $1,090 | $5,570 |
| 2021 | $363 | $6,660 | $1,090 | $5,570 |
| 2020 | $337 | $6,660 | $1,090 | $5,570 |
| 2019 | $358 | $6,660 | $1,090 | $5,570 |
| 2018 | $348 | $6,660 | $1,090 | $5,570 |
| 2017 | $347 | $6,660 | $1,090 | $5,570 |
| 2016 | $223 | $4,280 | $1,090 | $3,190 |
| 2015 | $222 | $4,280 | $1,090 | $3,190 |
| 2014 | $194 | $4,280 | $1,090 | $3,190 |
| 2013 | $194 | $4,560 | $1,090 | $3,470 |
Source: Public Records
Map
Nearby Homes
- 83 Maple Dr
- 328 Oak Knoll Ave
- 348 Arlington Blvd
- 344 Arlington Blvd
- 998 Woodglen Ave
- 4409 Ophelia St
- 2445 Newton Tomlinson Rd
- 4374 Richmond Ave
- 2721 E River Rd
- 2617 W River Rd
- 0 W Woodland Ave
- 0 2nd St
- 1 Olive St
- 535 Park Ave
- 38 W 8th St
- 4454 Warren Ravenna Rd
- 0 Miller Graber Rd SW
- 5484 Scott St
- 3250 State Route 534
- 0 State Route 5 Unit 5085736