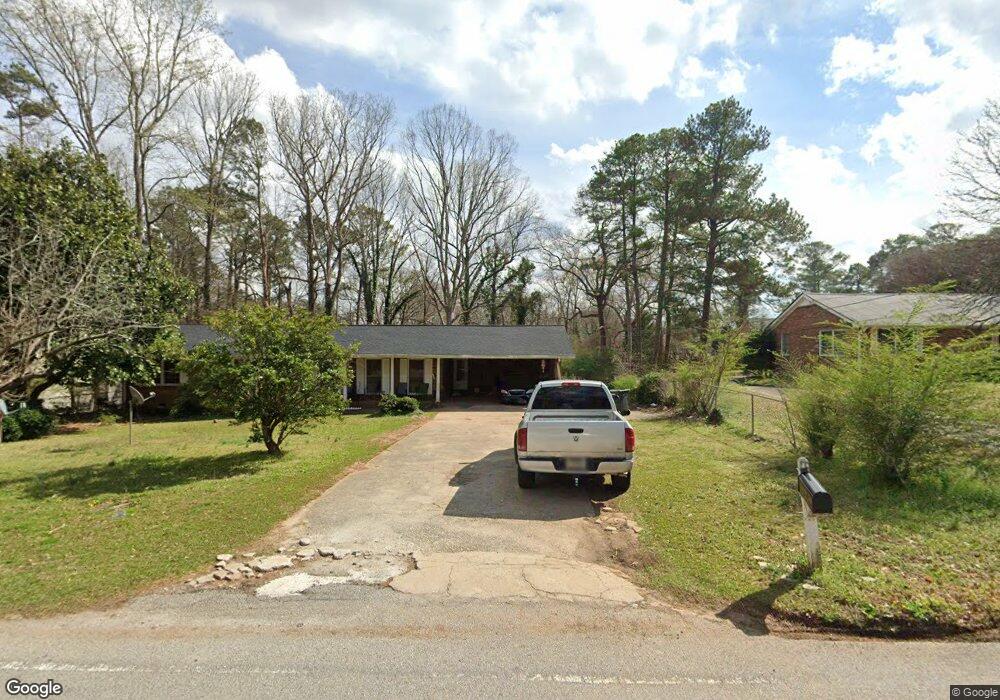
301 Nickajack Rd SW Mableton, GA 30126
Estimated Value: $357,387 - $439,000
3
Beds
3
Baths
1,746
Sq Ft
$234/Sq Ft
Est. Value
About This Home
This home is located at 301 Nickajack Rd SW, Mableton, GA 30126 and is currently estimated at $407,847, approximately $233 per square foot. 301 Nickajack Rd SW is a home located in Cobb County with nearby schools including Mableton Elementary School, Floyd Middle School, and Connection Pointe Christian Academy.
Ownership History
Date
Name
Owned For
Owner Type
Purchase Details
Closed on
Sep 10, 2009
Sold by
Tucker Richard A
Bought by
Tucker Richard B and Tucker Bonnie L
Current Estimated Value
Purchase Details
Closed on
Sep 3, 2004
Sold by
Sevenau Robin E
Bought by
Tucker Richard A and Tucker Bonnie
Create a Home Valuation Report for This Property
The Home Valuation Report is an in-depth analysis detailing your home's value as well as a comparison with similar homes in the area
Home Values in the Area
Average Home Value in this Area
Purchase History
| Date | Buyer | Sale Price | Title Company |
|---|---|---|---|
| Tucker Richard B | $200,000 | -- | |
| Tucker Richard A | -- | -- |
Source: Public Records
Tax History Compared to Growth
Tax History
| Year | Tax Paid | Tax Assessment Tax Assessment Total Assessment is a certain percentage of the fair market value that is determined by local assessors to be the total taxable value of land and additions on the property. | Land | Improvement |
|---|---|---|---|---|
| 2025 | $4,135 | $137,228 | $35,760 | $101,468 |
| 2024 | $4,137 | $137,228 | $35,760 | $101,468 |
| 2023 | $3,333 | $110,552 | $39,524 | $71,028 |
| 2022 | $2,876 | $94,756 | $33,876 | $60,880 |
| 2021 | $2,760 | $90,952 | $31,996 | $58,956 |
| 2020 | $2,532 | $83,424 | $24,468 | $58,956 |
| 2019 | $2,532 | $83,424 | $24,468 | $58,956 |
| 2018 | $2,058 | $67,812 | $13,176 | $54,636 |
| 2017 | $1,950 | $67,812 | $13,176 | $54,636 |
| 2016 | $1,817 | $63,196 | $11,292 | $51,904 |
| 2015 | $1,786 | $60,640 | $11,292 | $49,348 |
| 2014 | $1,802 | $60,640 | $0 | $0 |
Source: Public Records
Map
Nearby Homes
- 221 Shady Ln SW
- 647 Shannon Green Cir SW
- 450 Dorset Way SW
- 4800 Timberland Dr SW
- 26 Flint Ridge Dr SE
- 188 Covered Bridge Trail SW
- 35 Dunaire Ct SW
- 680 Sundial Ln
- 684 Sundial Ln
- 414 Landers Dr SW Unit 1
- 637 Carlouetta Rd SW
- 187 Fontaine Rd SW
- Jasper-Townhome Plan at Park View Reserve - Hometown Series
- Madeline-Townhome Plan at Park View Reserve - Hometown Series
- 4875 Millen Dr SE
- 470 Pineland Rd SW
- 639 Concord Rd SW
- 270 Dublin Ct SW Unit 2
- 4892 Oflaherty Ct SW Unit 2
- 333 Nickajack Rd SW
- 265 Dublin Ct SW Unit 2
- 4893 Oflaherty Ct SW
- 309 Nickajack Rd SW
- 262 Dublin Ct SW
- 321 Nickajack Rd SW
- 291 Nickajack Rd SW
- 259 Dublin Ct SW Unit 2
- 4898 Oflaherty Ct SW
- 4897 Oflaherty Ct SW
- 4897 Oflaherty Court Sw 0
- 281 Nickajack Rd SW
- 253 Dublin Ct SW
- 250 Dublin Ct SW Unit 2
- 281 Nickajack Rd SW
- 4904 Oflaherty Ct SW
- 260 Wexford Ct SW
- 345 Nickajack Rd SW