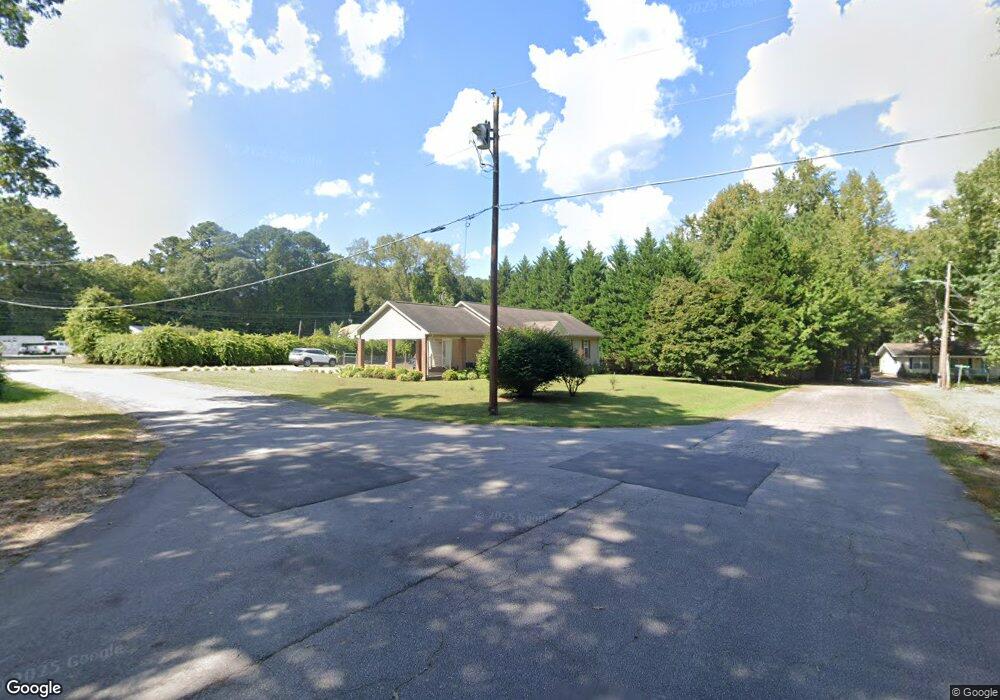
301 Oak Dr Louisburg, NC 27549
Estimated Value: $206,000 - $277,000
3
Beds
2
Baths
1,546
Sq Ft
$154/Sq Ft
Est. Value
About This Home
This home is located at 301 Oak Dr, Louisburg, NC 27549 and is currently estimated at $237,714, approximately $153 per square foot. 301 Oak Dr is a home located in Franklin County with nearby schools including Louisburg Elementary School, Terrell Lane Middle School, and Louisburg High School.
Ownership History
Date
Name
Owned For
Owner Type
Purchase Details
Closed on
Dec 30, 2016
Sold by
Perry Shonpaul
Bought by
Springs Judy and Hicks Bula Mae
Current Estimated Value
Home Financials for this Owner
Home Financials are based on the most recent Mortgage that was taken out on this home.
Original Mortgage
$136,363
Outstanding Balance
$111,234
Interest Rate
3.94%
Mortgage Type
New Conventional
Estimated Equity
$126,480
Purchase Details
Closed on
Feb 20, 2015
Sold by
Holiday Carrella
Bought by
Terry Ruby Regina
Purchase Details
Closed on
Mar 26, 2012
Sold by
Wood Kathleen W
Bought by
Terry Ruby R
Home Financials for this Owner
Home Financials are based on the most recent Mortgage that was taken out on this home.
Original Mortgage
$101,938
Interest Rate
3.89%
Mortgage Type
New Conventional
Purchase Details
Closed on
Nov 3, 1995
Bought by
Wood Cleotha and Wood Kathleen W
Create a Home Valuation Report for This Property
The Home Valuation Report is an in-depth analysis detailing your home's value as well as a comparison with similar homes in the area
Home Values in the Area
Average Home Value in this Area
Purchase History
| Date | Buyer | Sale Price | Title Company |
|---|---|---|---|
| Springs Judy | $135,000 | Attorney | |
| Terry Ruby Regina | -- | None Available | |
| Terry Ruby R | $100,000 | None Available | |
| Wood Cleotha | $8,500 | -- |
Source: Public Records
Mortgage History
| Date | Status | Borrower | Loan Amount |
|---|---|---|---|
| Open | Springs Judy | $136,363 | |
| Previous Owner | Terry Ruby R | $101,938 |
Source: Public Records
Tax History Compared to Growth
Tax History
| Year | Tax Paid | Tax Assessment Tax Assessment Total Assessment is a certain percentage of the fair market value that is determined by local assessors to be the total taxable value of land and additions on the property. | Land | Improvement |
|---|---|---|---|---|
| 2025 | $2,001 | $188,206 | $28,906 | $159,300 |
| 2024 | $2,001 | $188,206 | $28,906 | $159,300 |
| 2023 | $1,579 | $114,300 | $20,750 | $93,550 |
| 2022 | $1,512 | $114,300 | $20,750 | $93,550 |
| 2021 | $1,523 | $114,300 | $20,750 | $93,550 |
| 2020 | $1,527 | $114,300 | $20,750 | $93,550 |
| 2019 | $1,517 | $114,300 | $20,750 | $93,550 |
| 2018 | $1,512 | $114,300 | $20,750 | $93,550 |
| 2017 | $1,726 | $119,040 | $18,860 | $100,180 |
| 2016 | $1,794 | $119,040 | $18,860 | $100,180 |
| 2015 | $1,818 | $119,040 | $18,860 | $100,180 |
| 2014 | $1,730 | $119,040 | $18,860 | $100,180 |
Source: Public Records
Map
Nearby Homes
- 205 Williamson St
- 125 Davis St
- 191 Nc 56 Hwy E
- 401 N Main St
- 604 N Main St
- 121 Tanglewood Dr
- 4482 N Carolina 39 Hwy
- 612 N Main St
- 321 W Noble St
- 209 Tanglewood Dr
- 102 Tanglewood Dr
- 305 N Elm St
- 25 Leisure Ln
- 95 Leisure Ln
- 313 W Noble St
- 126 Person St
- 311 Nc 56 Hwy E
- 101 S Elm St
- 0-0 Halifax Rd
- 105 S Elm St