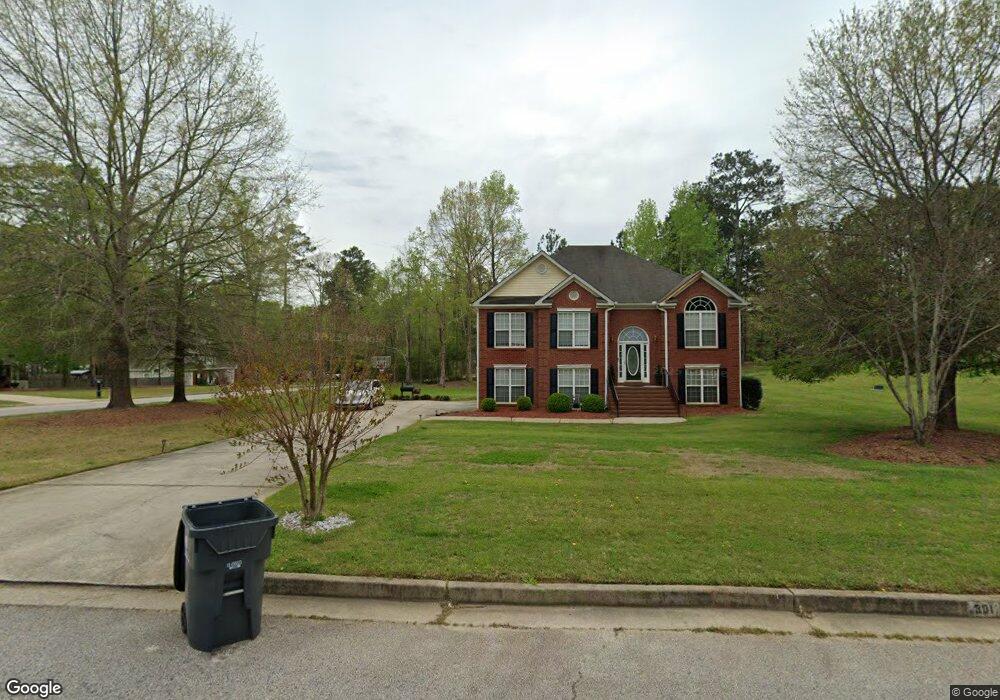
301 Oconee Ct McDonough, GA 30252
Estimated Value: $351,282 - $375,000
4
Beds
3
Baths
2,656
Sq Ft
$137/Sq Ft
Est. Value
About This Home
This home is located at 301 Oconee Ct, McDonough, GA 30252 and is currently estimated at $364,071, approximately $137 per square foot. 301 Oconee Ct is a home located in Henry County with nearby schools including New Hope Elementary School, Ola Middle School, and New Creation Christian Academy.
Ownership History
Date
Name
Owned For
Owner Type
Purchase Details
Closed on
Apr 3, 2019
Sold by
Glass Amanda
Bought by
Cooper Kendrick J and Cooper Takeria L
Current Estimated Value
Home Financials for this Owner
Home Financials are based on the most recent Mortgage that was taken out on this home.
Original Mortgage
$196,377
Outstanding Balance
$175,073
Interest Rate
5.12%
Mortgage Type
FHA
Estimated Equity
$188,998
Purchase Details
Closed on
Apr 15, 2011
Sold by
Hud-Housing Of Urban Dev
Bought by
Glass Amanda
Home Financials for this Owner
Home Financials are based on the most recent Mortgage that was taken out on this home.
Original Mortgage
$94,013
Interest Rate
5.25%
Mortgage Type
FHA
Purchase Details
Closed on
May 4, 2010
Sold by
Chase Hm Fin Llc
Bought by
Hud-Housing Of Urban Dev
Purchase Details
Closed on
Jun 6, 2003
Sold by
Gt Architecture Contractors Corp
Bought by
Reed Larry
Home Financials for this Owner
Home Financials are based on the most recent Mortgage that was taken out on this home.
Original Mortgage
$167,450
Interest Rate
5.3%
Mortgage Type
FHA
Create a Home Valuation Report for This Property
The Home Valuation Report is an in-depth analysis detailing your home's value as well as a comparison with similar homes in the area
Home Values in the Area
Average Home Value in this Area
Purchase History
| Date | Buyer | Sale Price | Title Company |
|---|---|---|---|
| Cooper Kendrick J | $200,000 | -- | |
| Glass Amanda | -- | -- | |
| Hud-Housing Of Urban Dev | -- | -- | |
| Chase Hm Fin Llc | $160,011 | -- | |
| Reed Larry | $170,200 | -- |
Source: Public Records
Mortgage History
| Date | Status | Borrower | Loan Amount |
|---|---|---|---|
| Open | Cooper Kendrick J | $196,377 | |
| Previous Owner | Glass Amanda | $94,013 | |
| Previous Owner | Reed Larry | $167,450 |
Source: Public Records
Tax History Compared to Growth
Tax History
| Year | Tax Paid | Tax Assessment Tax Assessment Total Assessment is a certain percentage of the fair market value that is determined by local assessors to be the total taxable value of land and additions on the property. | Land | Improvement |
|---|---|---|---|---|
| 2025 | $6,267 | $156,360 | $18,000 | $138,360 |
| 2024 | $6,267 | $140,600 | $18,000 | $122,600 |
| 2023 | $5,193 | $133,160 | $14,000 | $119,160 |
| 2022 | $4,277 | $109,280 | $14,000 | $95,280 |
| 2021 | $3,469 | $88,200 | $14,000 | $74,200 |
| 2020 | $3,154 | $80,000 | $11,680 | $68,320 |
| 2019 | $2,357 | $77,840 | $12,000 | $65,840 |
| 2018 | $2,143 | $68,800 | $12,000 | $56,800 |
| 2016 | $2,022 | $63,640 | $10,000 | $53,640 |
| 2015 | $1,919 | $57,600 | $8,000 | $49,600 |
| 2014 | $1,803 | $52,000 | $8,000 | $44,000 |
Source: Public Records
Map
Nearby Homes
- 151 River Park Cir
- 845 Graeme Dr
- 812 Graeme Dr
- 225 Laney Ct
- 767 Old Jackson Rd
- 153 Hilda Way
- 175 Laney Ct Unit 1
- 136 Hilda Way
- 461 Old Jackson Rd
- 215 Laney Rd
- 125 Laney Ct
- 2563 Highway 81 E
- 315 S Bethany Rd
- 275 S Bethany Rd
- 125 Karen Dr
- 995 Old Jackson Rd
- 281 Laney Dr
- 469 Kimberly Ct
- 242 Old Jackson Rd
- 136 Crown Forest Dr
- 303 Oconee Ct
- 0 Chestatee Trace Unit 8624823
- 0 Chestatee Trace Unit 8524063
- 0 Chestatee Trace Unit 8873344
- 0 Chestatee Trace Unit 3173154
- 0 Chestatee Trace Unit 7595756
- 300 Oconee Ct
- 164 River Park Cir
- 157 River Park Cir
- 0 River Park Cir Unit 8908982
- 0 River Park Cir Unit 7138655
- 0 River Park Cir Unit 8745913
- 0 River Park Cir Unit 8815656
- 0 River Park Cir Unit 8916170
- 0 River Park Cir Unit 3150879
- 0 River Park Cir Unit 3155968
- 0 River Park Cir Unit 7517168
- 0 River Park Cir Unit 8223560
- 0 River Park Cir Unit 8463134
- 0 River Park Cir