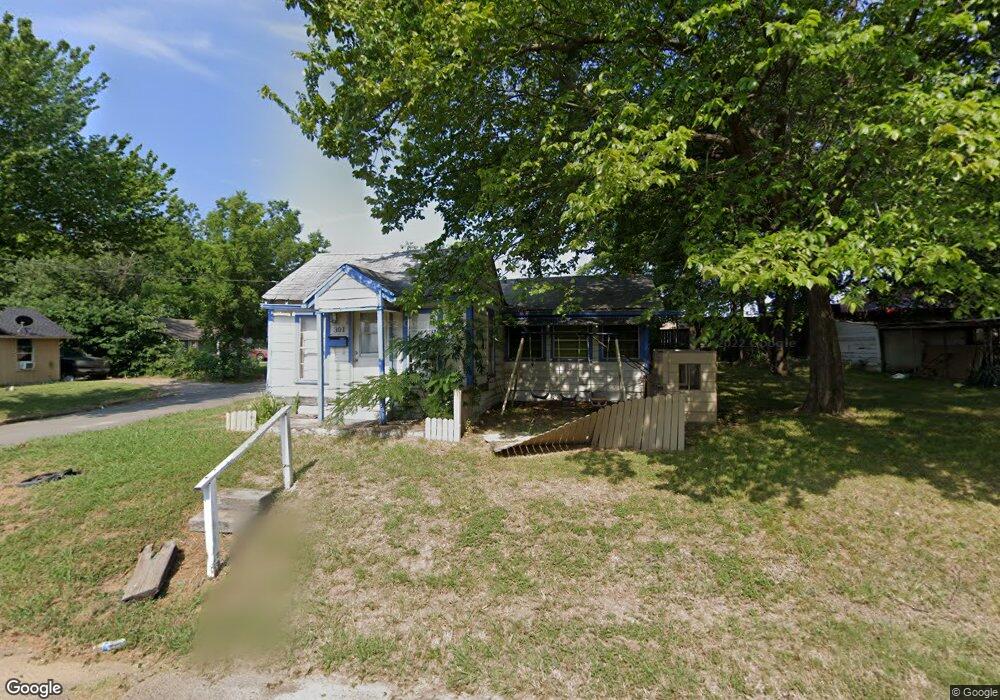
301 Pine St Bonham, TX 75418
Estimated Value: $115,000 - $172,000
1
Bed
1
Bath
596
Sq Ft
$258/Sq Ft
Est. Value
About This Home
This home is located at 301 Pine St, Bonham, TX 75418 and is currently estimated at $153,597, approximately $257 per square foot. 301 Pine St is a home located in Fannin County with nearby schools including Evans Elementary School, Finley-Oates Elementary School, and LH Rather Jr High School.
Ownership History
Date
Name
Owned For
Owner Type
Purchase Details
Closed on
Oct 28, 2021
Sold by
Brandy Rose
Bought by
Rose Kayley
Current Estimated Value
Create a Home Valuation Report for This Property
The Home Valuation Report is an in-depth analysis detailing your home's value as well as a comparison with similar homes in the area
Purchase History
| Date | Buyer | Sale Price | Title Company |
|---|---|---|---|
| Rose Kayley | -- | None Listed On Document |
Source: Public Records
Tax History
| Year | Tax Paid | Tax Assessment Tax Assessment Total Assessment is a certain percentage of the fair market value that is determined by local assessors to be the total taxable value of land and additions on the property. | Land | Improvement |
|---|---|---|---|---|
| 2025 | $3,135 | $161,630 | $21,130 | $140,500 |
| 2024 | $3,160 | $162,900 | $18,530 | $144,370 |
| 2023 | $677 | $34,330 | $17,800 | $16,530 |
| 2022 | $730 | $33,190 | $17,990 | $15,200 |
| 2021 | $833 | $32,950 | $20,750 | $12,200 |
| 2020 | $638 | $24,960 | $13,650 | $11,310 |
| 2019 | $624 | $23,480 | $13,650 | $9,830 |
| 2018 | $511 | $19,270 | $9,970 | $9,300 |
| 2017 | $482 | $18,870 | $9,970 | $8,900 |
| 2016 | $460 | $18,010 | $9,690 | $8,320 |
| 2015 | -- | $16,960 | $9,530 | $7,430 |
| 2014 | -- | $18,480 | $10,590 | $7,890 |
Source: Public Records
Map
Nearby Homes
- 202 Pine St
- 102 Elm St
- 306 E 2nd St
- 514 E 5th St
- 420 E 5th St
- 520 E 5th St
- 314 E 2nd St
- 716 E 5th St
- 410 E 6th St
- 700 E 6th St
- LOT 2 TBD County Road 2005
- TBD W Fm 274
- TBD LOT 1 County Road 2005
- tbd lot 3 County Road 2005
- 808 E 3rd St
- 808 E 6th St
- 816 E 6th St
- 503 Katy Blvd
- 820 E 6th St
- 611 Chestnut St
- 605 E 3rd St Unit A
- 605 E 3rd St
- 520 E Sam Rayburn Dr
- 609 E 3rd St
- 221 Pine St
- 602 E Sam Rayburn Dr
- 620 E Sam Rayburn Dr Unit RAYBURN
- 514 E 3rd St
- 220 Elm St
- 604 E 3rd St Unit 2
- 604 E 3rd St Unit A & B
- 604 E 3rd St
- 619 E Sam Rayburn Dr
- 210 Elm St
- 519 E 2nd St
- 513 E 2nd St
- 200 Pine St
- 612 E 3rd St Unit 1
- 612 E 3rd St
- 202 Elm St
Your Personal Tour Guide
Ask me questions while you tour the home.