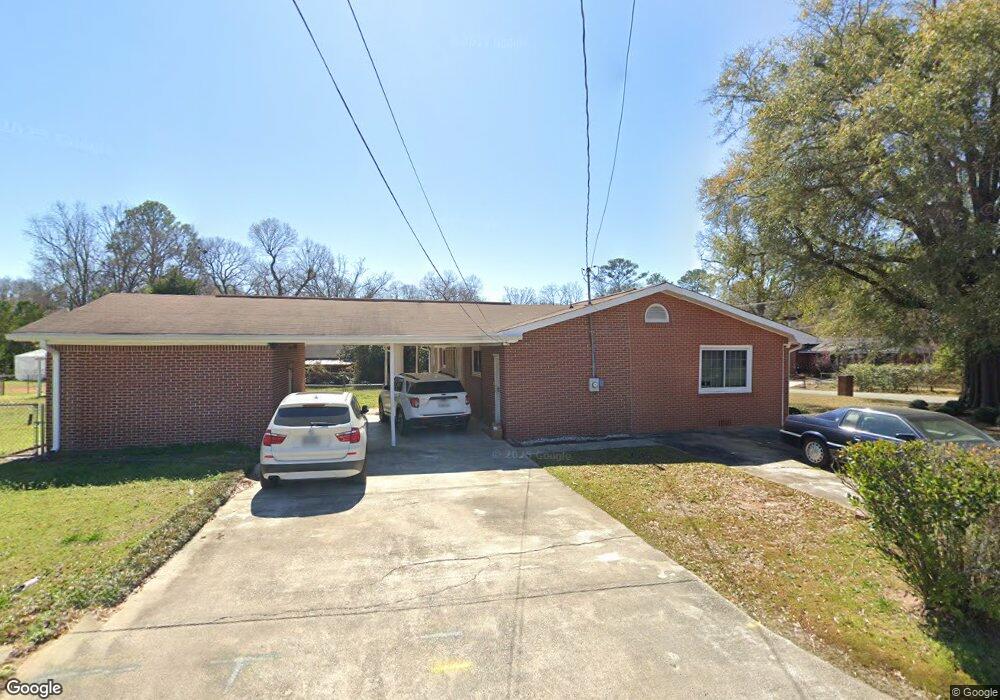
301 Pinecrest Dr Warner Robins, GA 31093
Estimated Value: $158,000 - $204,000
3
Beds
2
Baths
1,984
Sq Ft
$95/Sq Ft
Est. Value
About This Home
This home is located at 301 Pinecrest Dr, Warner Robins, GA 31093 and is currently estimated at $187,803, approximately $94 per square foot. 301 Pinecrest Dr is a home located in Houston County with nearby schools including Westside Elementary School, Northside Middle School, and Northside High School.
Ownership History
Date
Name
Owned For
Owner Type
Purchase Details
Closed on
Jul 24, 2007
Sold by
Horton Kenneth K
Bought by
Horton Kenneth K and Horton Nancy
Current Estimated Value
Home Financials for this Owner
Home Financials are based on the most recent Mortgage that was taken out on this home.
Original Mortgage
$132,500
Outstanding Balance
$83,378
Interest Rate
6.63%
Mortgage Type
New Conventional
Estimated Equity
$104,425
Purchase Details
Closed on
Jul 31, 1997
Sold by
Hood Williams S and Deborah A*
Bought by
Horton Kenneth K
Purchase Details
Closed on
Nov 30, 1992
Sold by
Taylor Henry M and Vivian E*
Bought by
Hood Williams S and Deborah A*
Purchase Details
Closed on
Jul 9, 1985
Sold by
Taylor Henry M and Taylor Vivian E
Bought by
Taylor Henry M and Vivian E*
Purchase Details
Closed on
Oct 31, 1966
Sold by
Barlow Joseph N
Bought by
Taylor Henry M and Taylor Vivian E
Purchase Details
Closed on
Jun 21, 1966
Sold by
Tower Inc & Whiting W D
Bought by
Barlow Joseph N
Purchase Details
Closed on
Sep 1, 1962
Bought by
Tower Inc & Whiting W D
Create a Home Valuation Report for This Property
The Home Valuation Report is an in-depth analysis detailing your home's value as well as a comparison with similar homes in the area
Home Values in the Area
Average Home Value in this Area
Purchase History
| Date | Buyer | Sale Price | Title Company |
|---|---|---|---|
| Horton Kenneth K | -- | Title Source Inc | |
| Horton Kenneth K | $78,500 | -- | |
| Hood Williams S | $64,500 | -- | |
| Taylor Henry M | -- | -- | |
| Taylor Henry M | -- | -- | |
| Barlow Joseph N | -- | -- | |
| Tower Inc & Whiting W D | -- | -- |
Source: Public Records
Mortgage History
| Date | Status | Borrower | Loan Amount |
|---|---|---|---|
| Open | Horton Kenneth K | $132,500 |
Source: Public Records
Tax History Compared to Growth
Tax History
| Year | Tax Paid | Tax Assessment Tax Assessment Total Assessment is a certain percentage of the fair market value that is determined by local assessors to be the total taxable value of land and additions on the property. | Land | Improvement |
|---|---|---|---|---|
| 2024 | $1,398 | $58,440 | $6,200 | $52,240 |
| 2023 | $1,162 | $48,080 | $6,200 | $41,880 |
| 2022 | $1,030 | $42,600 | $5,000 | $37,600 |
| 2021 | $936 | $38,520 | $5,000 | $33,520 |
| 2020 | $929 | $38,040 | $5,000 | $33,040 |
| 2019 | $929 | $38,040 | $5,000 | $33,040 |
| 2018 | $929 | $38,040 | $5,000 | $33,040 |
| 2017 | $929 | $38,040 | $5,000 | $33,040 |
| 2016 | $931 | $38,040 | $5,000 | $33,040 |
| 2015 | $933 | $38,040 | $5,000 | $33,040 |
| 2014 | -- | $38,040 | $5,000 | $33,040 |
| 2013 | -- | $38,920 | $5,000 | $33,920 |
Source: Public Records
Map
Nearby Homes
- 109 Heather St
- 110 Heather St
- 108 Heather St
- 300 Pinecrest Dr
- 107 Heather St
- 302 Pinecrest Dr
- 0 Heather St
- 200 Heather St
- 106 Heather St
- 304 Pinecrest Dr
- 103 Heather St
- 205 Pinecrest Dr
- 104 Heather St
- 202 Heather St
- 101 Redbud Cir
- 103 Redbud Cir
- 204 Pinecrest Dr
- 105 Redbud Cir
- 102 Heather St
- 204 Heather St