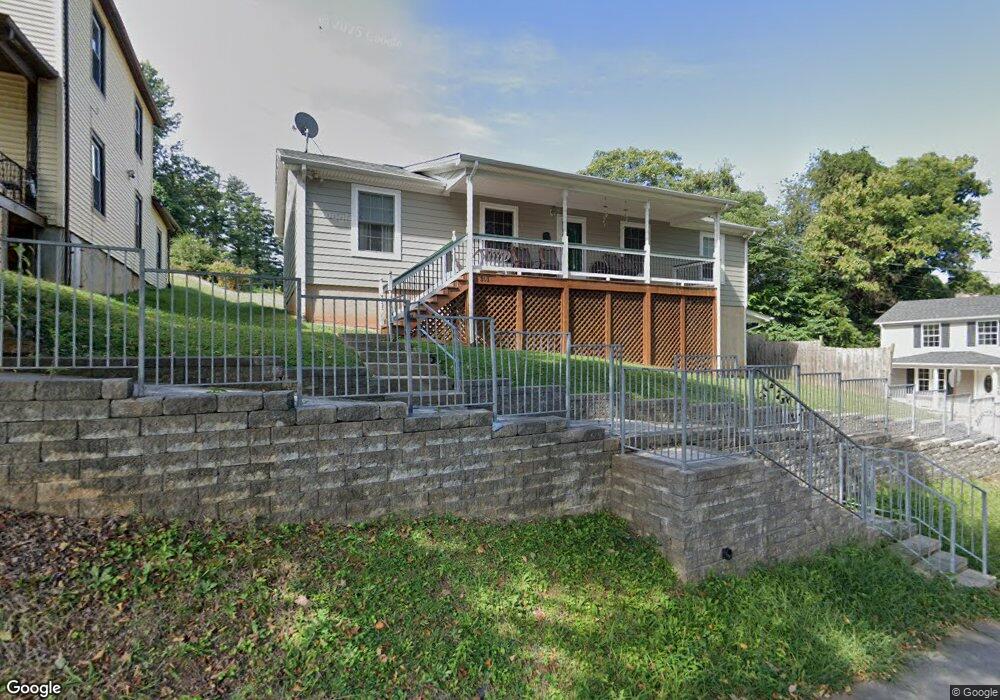
301 Polk St Lynchburg, VA 24504
Tinbridge Hill NeighborhoodEstimated Value: $163,000 - $242,000
3
Beds
2
Baths
1,255
Sq Ft
$152/Sq Ft
Est. Value
About This Home
This home is located at 301 Polk St, Lynchburg, VA 24504 and is currently estimated at $190,749, approximately $151 per square foot. 301 Polk St is a home located in Lynchburg City with nearby schools including Bedford Hills Elementary School, Linkhorne Middle School, and E.C. Glass High School.
Ownership History
Date
Name
Owned For
Owner Type
Purchase Details
Closed on
Jul 30, 2010
Sold by
Lynchburg Neighborhodd Development Found
Bought by
Crews Janet L
Current Estimated Value
Home Financials for this Owner
Home Financials are based on the most recent Mortgage that was taken out on this home.
Original Mortgage
$10,000
Interest Rate
4.57%
Mortgage Type
Stand Alone Second
Create a Home Valuation Report for This Property
The Home Valuation Report is an in-depth analysis detailing your home's value as well as a comparison with similar homes in the area
Home Values in the Area
Average Home Value in this Area
Purchase History
| Date | Buyer | Sale Price | Title Company |
|---|---|---|---|
| Crews Janet L | $95,000 | None Available |
Source: Public Records
Mortgage History
| Date | Status | Borrower | Loan Amount |
|---|---|---|---|
| Previous Owner | Crews Janet L | $10,000 | |
| Previous Owner | Crews Janet L | $87,935 |
Source: Public Records
Tax History Compared to Growth
Tax History
| Year | Tax Paid | Tax Assessment Tax Assessment Total Assessment is a certain percentage of the fair market value that is determined by local assessors to be the total taxable value of land and additions on the property. | Land | Improvement |
|---|---|---|---|---|
| 2025 | $1,602 | $190,700 | $15,000 | $175,700 |
| 2024 | $1,364 | $153,300 | $12,000 | $141,300 |
| 2023 | $1,702 | $153,300 | $12,000 | $141,300 |
| 2022 | $1,481 | $133,400 | $10,000 | $123,400 |
| 2021 | $1,481 | $133,400 | $10,000 | $123,400 |
| 2020 | $1,023 | $92,200 | $6,000 | $86,200 |
| 2019 | $1,023 | $92,200 | $6,000 | $86,200 |
| 2018 | $1,023 | $92,200 | $6,000 | $86,200 |
| 2017 | $1,023 | $92,200 | $6,000 | $86,200 |
| 2016 | $1,023 | $92,200 | $6,000 | $86,200 |
| 2015 | $1,023 | $97,600 | $3,000 | $94,600 |
| 2014 | $1,083 | $108,700 | $3,000 | $105,700 |
Source: Public Records
Map
Nearby Homes