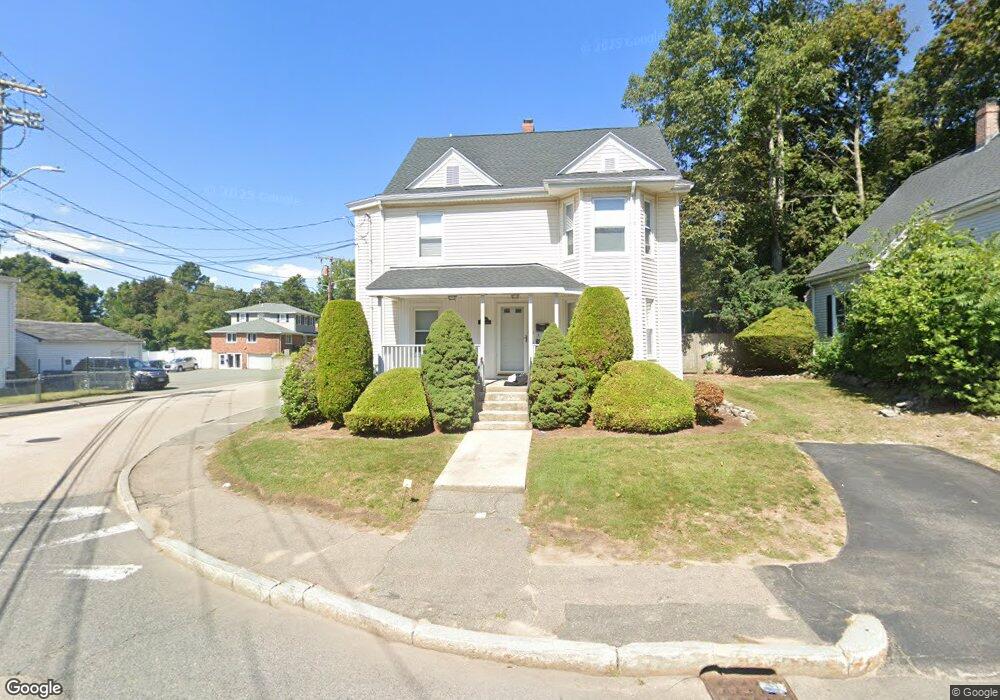
301 Pond St Braintree, MA 02184
South Braintree NeighborhoodEstimated Value: $655,000 - $884,000
2
Beds
2
Baths
1,982
Sq Ft
$383/Sq Ft
Est. Value
About This Home
This home is located at 301 Pond St, Braintree, MA 02184 and is currently estimated at $758,914, approximately $382 per square foot. 301 Pond St is a home located in Norfolk County with nearby schools including Braintree High School, Step Ahead Kindergarten, and Thayer Academy.
Ownership History
Date
Name
Owned For
Owner Type
Purchase Details
Closed on
Jan 7, 2026
Sold by
Ranieri Gregory A
Bought by
Lot 398 Rt and Ranieri
Current Estimated Value
Purchase Details
Closed on
Dec 29, 2010
Sold by
Ranieri Michael A and Ranieri Gail M
Bought by
Ranieri Gregory A
Purchase Details
Closed on
Oct 1, 2003
Sold by
Fernandez Javier O
Bought by
Ranieri Gregory E
Home Financials for this Owner
Home Financials are based on the most recent Mortgage that was taken out on this home.
Original Mortgage
$380,000
Interest Rate
6.25%
Mortgage Type
Purchase Money Mortgage
Purchase Details
Closed on
Mar 3, 2000
Sold by
Cohen Tr Marie M
Bought by
Fernandez Javier O
Home Financials for this Owner
Home Financials are based on the most recent Mortgage that was taken out on this home.
Original Mortgage
$297,000
Interest Rate
8.21%
Mortgage Type
Purchase Money Mortgage
Purchase Details
Closed on
Aug 5, 1999
Sold by
Chambers Judith A and Chambers David L
Bought by
Pond St Rt
Create a Home Valuation Report for This Property
The Home Valuation Report is an in-depth analysis detailing your home's value as well as a comparison with similar homes in the area
Home Values in the Area
Average Home Value in this Area
Purchase History
| Date | Buyer | Sale Price | Title Company |
|---|---|---|---|
| Lot 398 Rt | -- | -- | |
| Ranieri Gregory A | -- | -- | |
| Ranieri Gregory E | $475,000 | -- | |
| Fernandez Javier O | $330,000 | -- | |
| Pond St Rt | $155,000 | -- |
Source: Public Records
Mortgage History
| Date | Status | Borrower | Loan Amount |
|---|---|---|---|
| Previous Owner | Pond St Rt | $336,000 | |
| Previous Owner | Ranieri Gregory E | $380,000 | |
| Previous Owner | Pond St Rt | $297,000 |
Source: Public Records
Tax History
| Year | Tax Paid | Tax Assessment Tax Assessment Total Assessment is a certain percentage of the fair market value that is determined by local assessors to be the total taxable value of land and additions on the property. | Land | Improvement |
|---|---|---|---|---|
| 2025 | $6,951 | $696,500 | $295,100 | $401,400 |
| 2024 | $6,380 | $673,000 | $280,100 | $392,900 |
| 2023 | $6,008 | $615,600 | $250,100 | $365,500 |
| 2022 | $6,026 | $605,600 | $240,100 | $365,500 |
| 2021 | $5,727 | $575,600 | $210,100 | $365,500 |
| 2020 | $5,423 | $550,000 | $210,100 | $339,900 |
| 2019 | $5,058 | $501,300 | $200,100 | $301,200 |
| 2018 | $4,938 | $468,500 | $180,100 | $288,400 |
| 2017 | $4,522 | $421,000 | $160,000 | $261,000 |
| 2016 | $4,213 | $383,700 | $150,000 | $233,700 |
| 2015 | $4,181 | $377,700 | $144,000 | $233,700 |
| 2014 | $3,924 | $343,600 | $130,000 | $213,600 |
Source: Public Records
Map
Nearby Homes
- 6 Lunar Ave
- 80 Lake St
- 29 Saint Michael Rd
- 18 Royal Lake Dr Unit 3
- 614 Pond St Unit 2104
- 6 Franklin St
- 145 Hancock St Unit 307
- 145 Hancock St Unit 309
- 4 Powdrell Ave
- 107 Meadow Ln Unit 107
- 47 Addison St
- 1579 Washington St
- 700 North St
- 15 Calvin St
- 70 Alida Rd
- 661 North St
- 15 Alida Rd
- 418 John Mahar Hwy Unit 408
- 5 Woodsum Dr Unit 12
- 6 Oak St
Your Personal Tour Guide
Ask me questions while you tour the home.