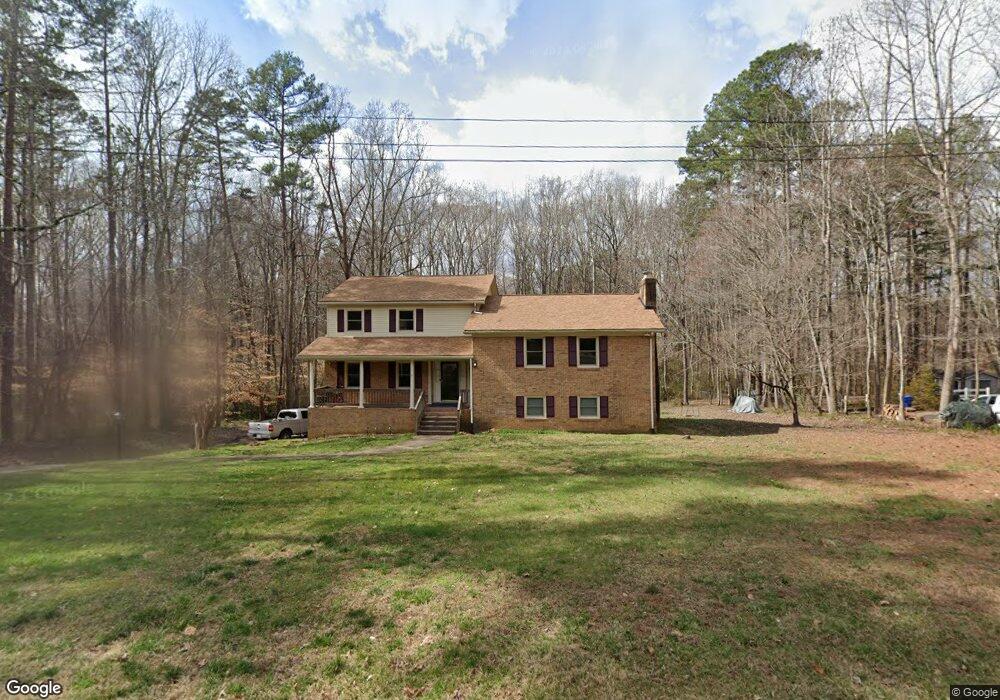
301 Primrose Dr Salisbury, NC 28147
Estimated Value: $303,000 - $401,066
5
Beds
4
Baths
2,920
Sq Ft
$121/Sq Ft
Est. Value
About This Home
This home is located at 301 Primrose Dr, Salisbury, NC 28147 and is currently estimated at $353,517, approximately $121 per square foot. 301 Primrose Dr is a home located in Rowan County with nearby schools including West Rowan Elementary, West Rowan Middle School, and West Rowan High School.
Ownership History
Date
Name
Owned For
Owner Type
Purchase Details
Closed on
Jan 10, 2019
Sold by
One Cuttlefish Llc
Bought by
Ford Kenneth D and Ford Shawnita A
Current Estimated Value
Home Financials for this Owner
Home Financials are based on the most recent Mortgage that was taken out on this home.
Original Mortgage
$16,550
Outstanding Balance
$14,580
Interest Rate
4.7%
Mortgage Type
New Conventional
Estimated Equity
$338,937
Purchase Details
Closed on
Jun 15, 2015
Sold by
One Diamond Homes Llc
Bought by
One Cuttlefish Llc
Purchase Details
Closed on
Jan 6, 2015
Sold by
Federal Home Loan Mortgage Corporation
Bought by
One Diamond Homes Llc
Purchase Details
Closed on
Jan 14, 2013
Sold by
Bumgarner Jeff W and Bumgarner Verna M
Bought by
Federal Home Loan Mortgage Corporation
Purchase Details
Closed on
Mar 30, 2005
Sold by
Bumgarner Jeff W and Bumgarner Verna M
Bought by
Bumgarner Verna M
Create a Home Valuation Report for This Property
The Home Valuation Report is an in-depth analysis detailing your home's value as well as a comparison with similar homes in the area
Purchase History
| Date | Buyer | Sale Price | Title Company |
|---|---|---|---|
| Ford Kenneth D | $169,000 | None Available | |
| One Cuttlefish Llc | -- | None Available | |
| One Diamond Homes Llc | -- | Chicago Title Insurance Co | |
| Federal Home Loan Mortgage Corporation | $118,655 | None Available | |
| Bumgarner Verna M | -- | None Available |
Source: Public Records
Mortgage History
| Date | Status | Borrower | Loan Amount |
|---|---|---|---|
| Open | Ford Kenneth D | $16,550 |
Source: Public Records
Tax History
| Year | Tax Paid | Tax Assessment Tax Assessment Total Assessment is a certain percentage of the fair market value that is determined by local assessors to be the total taxable value of land and additions on the property. | Land | Improvement |
|---|---|---|---|---|
| 2025 | $1,631 | $243,416 | $28,500 | $214,916 |
| 2024 | $1,631 | $243,416 | $28,500 | $214,916 |
| 2023 | $1,631 | $243,416 | $28,500 | $214,916 |
| 2022 | $1,132 | $151,409 | $23,500 | $127,909 |
| 2021 | $1,104 | $151,409 | $23,500 | $127,909 |
| 2020 | $1,104 | $151,409 | $23,500 | $127,909 |
| 2019 | $1,104 | $151,409 | $23,500 | $127,909 |
| 2018 | $960 | $132,729 | $23,500 | $109,229 |
| 2017 | $960 | $132,729 | $23,500 | $109,229 |
| 2016 | $960 | $132,729 | $23,500 | $109,229 |
| 2015 | $974 | $132,729 | $23,500 | $109,229 |
| 2014 | $993 | $137,972 | $23,500 | $114,472 |
Source: Public Records
Map
Nearby Homes
- 0 Catawba Dr
- 165 Swinford Dr Unit 82
- 370 Ford Rd
- 155 Swinford Dr Unit 83
- 00 Kepley Rd
- 108 Athens Dr
- 325 Scaley Bark Dr
- 245 Cherokee Ln
- 4630 Woodleaf Rd
- 170 Smoke Ln Unit L3
- 140 Smoke Ln
- 7465 Jones Rd
- 2855 Gheen Rd
- 109 Larch Rd
- 1030 Hurley School Rd
- 107 Larch Rd
- 218 Saint Francis Rd
- 212 Saint Francis Rd
- The Harrington Plan at Winecoff
- The Coleman Plan at Winecoff
- 301 Primrose Dr Unit 17
- 305 Primrose Dr
- 240 Primrose Dr
- Lot 9 & 10 Primrose Dr
- 640 Catawba Dr
- 630 Catawba Dr
- 400 Primrose Dr
- 230 Primrose Dr
- 650 Catawba Dr
- 410 Primrose Dr
- 435 Brook Cir
- 620 Catawba Dr
- 425 Brook Cir
- Lot 74 Brook Cir
- 325 Primrose Dr
- 420 Primrose Dr
- 225 Primrose Dr
- Lots 8,9,1 Primrose Dr
- 655 Catawba Dr
- 401 Primrose Dr
Your Personal Tour Guide
Ask me questions while you tour the home.