Estimated Value: $440,152 - $475,000
4
Beds
3
Baths
2,151
Sq Ft
$210/Sq Ft
Est. Value
About This Home
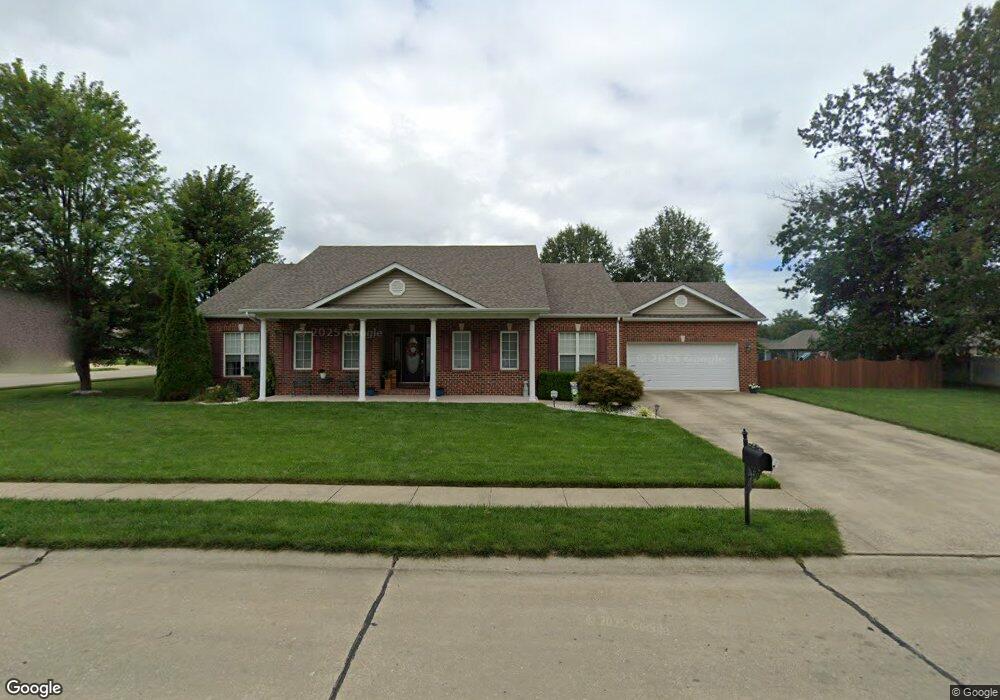
This home is located at 301 Quail Lake Dr, Troy, IL 62294 and is currently estimated at $452,288, approximately $210 per square foot. 301 Quail Lake Dr is a home located in Madison County with nearby schools including Silver Creek Elementary School, Triad Middle School, and Triad High School.
Ownership History
Date
Name
Owned For
Owner Type
Purchase Details
Closed on
Dec 27, 2011
Sold by
Kappler Greg and Kappler Melissa
Bought by
Loveland Melissa S and Shaw David A
Current Estimated Value
Home Financials for this Owner
Home Financials are based on the most recent Mortgage that was taken out on this home.
Original Mortgage
$213,000
Outstanding Balance
$145,467
Interest Rate
3.9%
Mortgage Type
New Conventional
Estimated Equity
$306,821
Purchase Details
Closed on
Mar 9, 2005
Sold by
Brentwood Homes Llc
Bought by
Kappler Greg and Kappler Melissa
Home Financials for this Owner
Home Financials are based on the most recent Mortgage that was taken out on this home.
Original Mortgage
$183,900
Interest Rate
5.7%
Mortgage Type
Purchase Money Mortgage
Purchase Details
Closed on
Jun 9, 2004
Sold by
Osborn Donald P and Osborn Joseph E
Bought by
Brentwood Homes Llc
Create a Home Valuation Report for This Property
The Home Valuation Report is an in-depth analysis detailing your home's value as well as a comparison with similar homes in the area
Home Values in the Area
Average Home Value in this Area
Purchase History
| Date | Buyer | Sale Price | Title Company |
|---|---|---|---|
| Loveland Melissa S | $228,000 | None Available | |
| Kappler Greg | $230,000 | First American Title Ins Co | |
| Brentwood Homes Llc | $44,000 | Abstracts & Titles Inc |
Source: Public Records
Mortgage History
| Date | Status | Borrower | Loan Amount |
|---|---|---|---|
| Open | Loveland Melissa S | $213,000 | |
| Previous Owner | Kappler Greg | $183,900 | |
| Closed | Kappler Greg | $16,000 |
Source: Public Records
Tax History Compared to Growth
Tax History
| Year | Tax Paid | Tax Assessment Tax Assessment Total Assessment is a certain percentage of the fair market value that is determined by local assessors to be the total taxable value of land and additions on the property. | Land | Improvement |
|---|---|---|---|---|
| 2024 | $7,754 | $116,360 | $24,160 | $92,200 |
| 2023 | $7,754 | $106,280 | $22,070 | $84,210 |
| 2022 | $7,238 | $96,360 | $20,010 | $76,350 |
| 2021 | $6,609 | $91,100 | $18,920 | $72,180 |
| 2020 | $6,551 | $87,960 | $18,270 | $69,690 |
| 2019 | $6,365 | $86,620 | $17,990 | $68,630 |
| 2018 | $6,284 | $81,500 | $16,930 | $64,570 |
| 2017 | $6,086 | $78,710 | $16,350 | $62,360 |
| 2016 | $5,950 | $78,710 | $16,350 | $62,360 |
| 2015 | $5,350 | $75,060 | $16,230 | $58,830 |
| 2014 | $5,350 | $75,060 | $16,230 | $58,830 |
| 2013 | $5,350 | $75,060 | $16,230 | $58,830 |
Source: Public Records
Map
Nearby Homes
- 530 Franklin Ave
- 212 Red Bird St
- 2335 Staunton Rd
- 518 Bargraves Blvd Unit B
- 210 Hazel St
- 301 Ackerman Place
- 7832 Zenk Rd
- 319 Jarvis Ct Unit A
- 121 W Clay St
- 584 Berkshire Dr
- 120 Collinsville Rd
- Tbd Lower Marine Rd
- 13 Sonata Ln
- 102 W High St
- 15 Sonata Ln
- 2001 Serenade Ln
- 0 Lower Marine Rd Unit MIS25066224
- 511 Ruddy Ct
- 2024 Serenade Ln
- 106 James Dr
- 269 Harbor Mill Dr
- 265 Harbor Mill Dr
- 304 Quail Lake Dr
- 100 N Timber Terrace
- 248 Harbor Mill Dr
- 261 Harbor Mill Dr
- 244 Harbor Mill Dr
- 252 Harbor Mill Dr
- 104 Timber Terrace
- 2 Timber Terrace
- 240 Harbor Mill Dr
- 108 Timber Terrace
- 108 N Timber
- 257 Harbor Mill Dr
- 236 Harbor Mill Dr
- 112 N Timber Terrace
- 273 Harbor Mill Dr
- 256 Harbor Mill Dr
- 6 Timber Terrace
- 232 Harbor Mill Dr