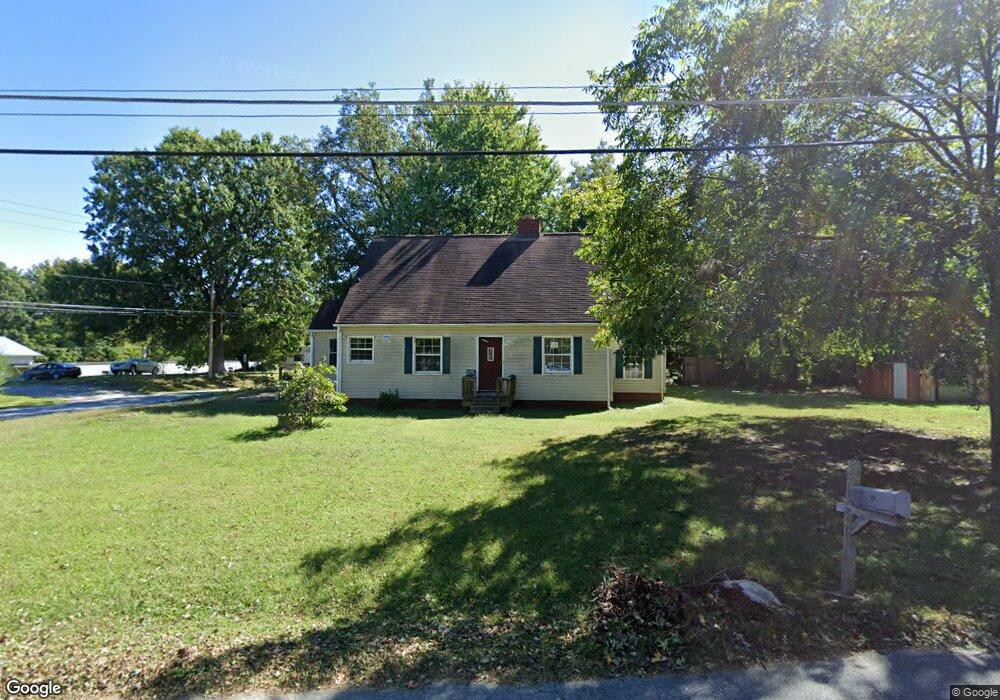
301 Ranch Dr High Point, NC 27263
Greater High Point NeighborhoodEstimated Value: $118,000 - $214,000
3
Beds
1
Bath
1,208
Sq Ft
$144/Sq Ft
Est. Value
About This Home
This home is located at 301 Ranch Dr, High Point, NC 27263 and is currently estimated at $173,609, approximately $143 per square foot. 301 Ranch Dr is a home located in Guilford County with nearby schools including Allen Jay Elementary School, Southern Guilford Middle, and Southern Guilford High School.
Ownership History
Date
Name
Owned For
Owner Type
Purchase Details
Closed on
Apr 5, 2022
Sold by
Secretary Of Veterans Affairs
Bought by
Luo Haiyang
Current Estimated Value
Purchase Details
Closed on
Nov 4, 2021
Sold by
Lakeview Loan Servicing Llc
Bought by
Secretary Of Veterans Affairs
Purchase Details
Closed on
Oct 28, 2021
Sold by
Brown Hicks Yvonne Nicole
Bought by
Holland Stevie Lynn
Purchase Details
Closed on
Oct 26, 2021
Sold by
Substitute Trustee Services Inc
Bought by
Lakeview Loan Servicing Llc
Purchase Details
Closed on
Sep 14, 2001
Sold by
Henderson H Richard and Henderson Beverly K
Bought by
Williams Clarence E
Home Financials for this Owner
Home Financials are based on the most recent Mortgage that was taken out on this home.
Original Mortgage
$89,650
Interest Rate
6.98%
Mortgage Type
VA
Create a Home Valuation Report for This Property
The Home Valuation Report is an in-depth analysis detailing your home's value as well as a comparison with similar homes in the area
Home Values in the Area
Average Home Value in this Area
Purchase History
| Date | Buyer | Sale Price | Title Company |
|---|---|---|---|
| Luo Haiyang | -- | None Listed On Document | |
| Luo Haiyang | -- | None Listed On Document | |
| Secretary Of Veterans Affairs | -- | None Listed On Document | |
| Holland Stevie Lynn | -- | Chicago Title | |
| Lakeview Loan Servicing Llc | $96,161 | Hutchens Law Firm Llp | |
| Williams Clarence E | $93,000 | -- |
Source: Public Records
Mortgage History
| Date | Status | Borrower | Loan Amount |
|---|---|---|---|
| Previous Owner | Williams Clarence E | $89,650 |
Source: Public Records
Tax History
| Year | Tax Paid | Tax Assessment Tax Assessment Total Assessment is a certain percentage of the fair market value that is determined by local assessors to be the total taxable value of land and additions on the property. | Land | Improvement |
|---|---|---|---|---|
| 2025 | $812 | $92,600 | $20,000 | $72,600 |
| 2024 | $812 | $92,600 | $20,000 | $72,600 |
| 2023 | $812 | $92,600 | $20,000 | $72,600 |
| 2022 | $812 | $92,600 | $20,000 | $72,600 |
| 2021 | $803 | $91,600 | $20,000 | $71,600 |
| 2020 | $803 | $91,600 | $20,000 | $71,600 |
| 2019 | $803 | $91,600 | $0 | $0 |
| 2018 | $799 | $91,600 | $0 | $0 |
| 2017 | $775 | $91,600 | $0 | $0 |
| 2016 | $830 | $94,900 | $0 | $0 |
| 2015 | $835 | $94,900 | $0 | $0 |
| 2014 | $845 | $94,900 | $0 | $0 |
Source: Public Records
Map
Nearby Homes
- 919 Belmont Dr
- 717 Belmont Dr
- 600 E Fairfield Rd
- 116 Liberty Place
- 611 Liberty Rd
- 000 Liberty Rd
- 715 Baker Rd
- 914 Nance Ave
- 126 Apollo Cir
- 921 Norton St
- 1105 E Springfield Rd
- 10844 N Main St
- 10812, 10822, 10828 N Main St
- 312 Playground Rd
- 1606 Chelsea Square
- 1535 E Fairfield Rd
- 209 Purvis Ln
- 3813 Salisbury St
- 902 Brittany Way
- 818 Westbrook Ct Unit 818
Your Personal Tour Guide
Ask me questions while you tour the home.