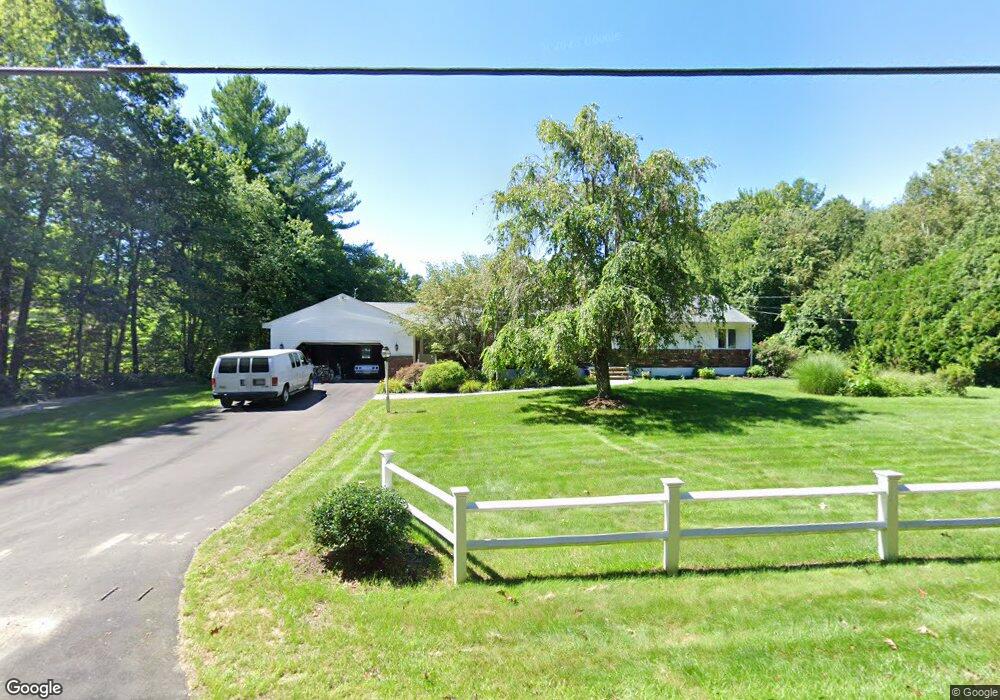
301 River St Leicester, MA 01524
Estimated Value: $471,000 - $635,000
3
Beds
2
Baths
2,393
Sq Ft
$234/Sq Ft
Est. Value
About This Home
This home is located at 301 River St, Leicester, MA 01524 and is currently estimated at $558,781, approximately $233 per square foot. 301 River St is a home located in Worcester County with nearby schools including Leicester Integrated Preschool, Leicester Memorial Elementary School, and Leicester Middle School.
Ownership History
Date
Name
Owned For
Owner Type
Purchase Details
Closed on
Jan 26, 2009
Sold by
Pare David G and Pare Rose V
Bought by
Pare Rose
Current Estimated Value
Home Financials for this Owner
Home Financials are based on the most recent Mortgage that was taken out on this home.
Original Mortgage
$90,000
Outstanding Balance
$58,127
Interest Rate
5.51%
Mortgage Type
Purchase Money Mortgage
Estimated Equity
$500,654
Create a Home Valuation Report for This Property
The Home Valuation Report is an in-depth analysis detailing your home's value as well as a comparison with similar homes in the area
Home Values in the Area
Average Home Value in this Area
Purchase History
| Date | Buyer | Sale Price | Title Company |
|---|---|---|---|
| Pare Rose | -- | -- |
Source: Public Records
Mortgage History
| Date | Status | Borrower | Loan Amount |
|---|---|---|---|
| Open | Pare Rose | $90,000 |
Source: Public Records
Tax History
| Year | Tax Paid | Tax Assessment Tax Assessment Total Assessment is a certain percentage of the fair market value that is determined by local assessors to be the total taxable value of land and additions on the property. | Land | Improvement |
|---|---|---|---|---|
| 2025 | $65 | $554,400 | $83,300 | $471,100 |
| 2024 | $6,260 | $498,800 | $72,100 | $426,700 |
| 2023 | $5,937 | $461,700 | $72,100 | $389,600 |
| 2022 | $5,704 | $407,700 | $68,900 | $338,800 |
| 2021 | $6,050 | $399,900 | $68,900 | $331,000 |
| 2020 | $5,526 | $370,600 | $65,100 | $305,500 |
| 2019 | $5,316 | $352,500 | $58,500 | $294,000 |
| 2018 | $5,118 | $318,100 | $58,500 | $259,600 |
| 2017 | $4,788 | $309,300 | $58,500 | $250,800 |
| 2016 | $4,474 | $300,300 | $72,900 | $227,400 |
| 2015 | $4,366 | $300,300 | $72,900 | $227,400 |
Source: Public Records
Map
Nearby Homes
- 10 Park Ln
- 2 Wendy Place
- 8 Sunset Dr
- 10 Edward St
- 75 Huntoon Memorial Hwy Unit 1-2
- 94 Clark Rd
- 40 Lakeview Dr
- 502 Pine St
- 25 Clark Rd
- 404 Rawson St
- 41 Kingsbury Rd
- 748-A Stafford St
- 620 Henshaw St
- 6 Ryans Way Unit 6
- 0 Kingsbury Rd
- 2 Shelter Ridge Rd
- 1 Cole Dr Unit 1
- 707 Stafford St
- 1548 Main St
- 1576 Main St
Your Personal Tour Guide
Ask me questions while you tour the home.