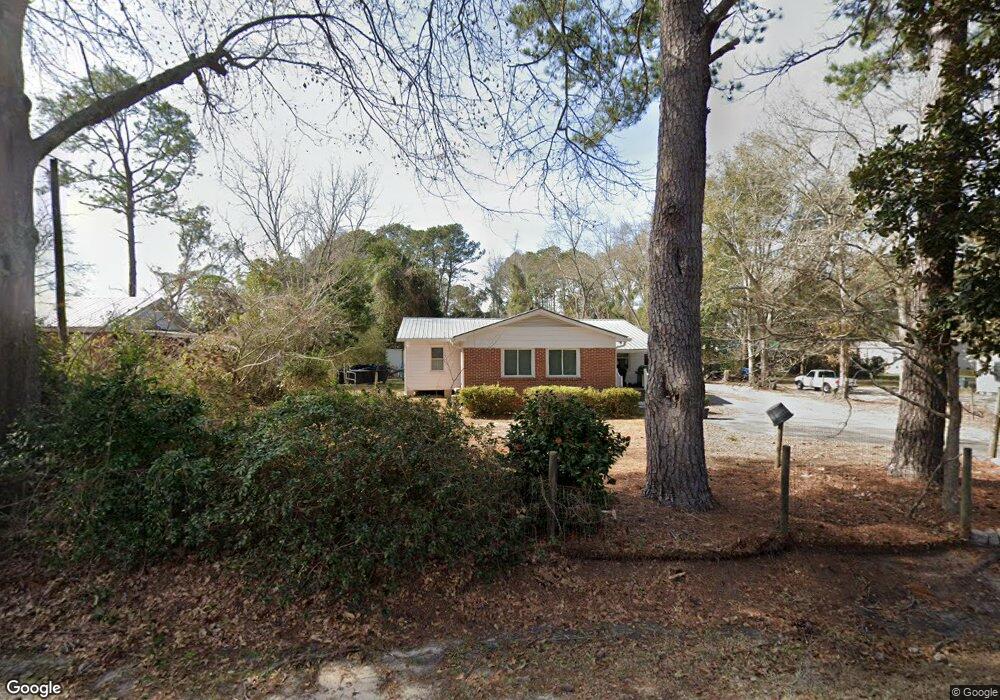
301 Russell Rd Thomasville, GA 31757
Estimated Value: $146,000 - $180,000
--
Bed
1
Bath
1,569
Sq Ft
$105/Sq Ft
Est. Value
About This Home
This home is located at 301 Russell Rd, Thomasville, GA 31757 and is currently estimated at $164,856, approximately $105 per square foot. 301 Russell Rd is a home located in Thomas County with nearby schools including Hand in Hand Primary School, Garrison-Pilcher Elementary School, and Cross Creek Elementary School.
Ownership History
Date
Name
Owned For
Owner Type
Purchase Details
Closed on
Aug 29, 2018
Sold by
Wallace Amanda A
Bought by
Parker Matt
Current Estimated Value
Home Financials for this Owner
Home Financials are based on the most recent Mortgage that was taken out on this home.
Original Mortgage
$58,421
Interest Rate
4.6%
Mortgage Type
New Conventional
Purchase Details
Closed on
Aug 28, 2018
Sold by
Adams Philip T
Bought by
Wallace Amanda A
Home Financials for this Owner
Home Financials are based on the most recent Mortgage that was taken out on this home.
Original Mortgage
$58,421
Interest Rate
4.6%
Mortgage Type
New Conventional
Purchase Details
Closed on
Jan 13, 1999
Sold by
Pilkinton Michael
Bought by
Adams Amanda A
Purchase Details
Closed on
Nov 5, 1998
Bought by
Pilkinton Michael
Create a Home Valuation Report for This Property
The Home Valuation Report is an in-depth analysis detailing your home's value as well as a comparison with similar homes in the area
Home Values in the Area
Average Home Value in this Area
Purchase History
| Date | Buyer | Sale Price | Title Company |
|---|---|---|---|
| Parker Matt | $57,000 | -- | |
| Wallace Amanda A | -- | -- | |
| Adams Amanda A | $35,000 | -- | |
| Pilkinton Michael | -- | -- |
Source: Public Records
Mortgage History
| Date | Status | Borrower | Loan Amount |
|---|---|---|---|
| Closed | Parker Matt | $58,421 |
Source: Public Records
Tax History Compared to Growth
Tax History
| Year | Tax Paid | Tax Assessment Tax Assessment Total Assessment is a certain percentage of the fair market value that is determined by local assessors to be the total taxable value of land and additions on the property. | Land | Improvement |
|---|---|---|---|---|
| 2024 | $869 | $41,588 | $10,120 | $31,468 |
| 2023 | $794 | $38,847 | $9,200 | $29,647 |
| 2022 | $687 | $30,295 | $8,000 | $22,295 |
| 2021 | $682 | $27,149 | $8,000 | $19,149 |
| 2020 | $694 | $26,912 | $8,000 | $18,912 |
| 2019 | $595 | $26,712 | $7,800 | $18,912 |
| 2018 | $657 | $26,287 | $7,800 | $18,487 |
| 2017 | $653 | $25,760 | $6,942 | $18,818 |
| 2016 | $658 | $25,733 | $6,942 | $18,791 |
| 2015 | $726 | $27,754 | $6,474 | $21,280 |
| 2014 | $699 | $26,640 | $6,474 | $20,166 |
| 2013 | -- | $26,639 | $6,474 | $20,165 |
Source: Public Records
Map
Nearby Homes
- 138
- 00 Cone Road & Beulah Church Rd
- 226 Glem Dr
- 589 Crabapple Dr
- 622 Libby Ln
- 1016 State Route 38 Con
- 233 Fox Meadow Ln
- 454 Fox Meadow Ln
- 72 Marcia Ln
- 260 Sunrise Cir
- 33 Inman Ln
- 10.04ACR Gatlin Creek Rd
- 246 Whipowill Bend
- 115 Lakeside Dr
- 111 Greenleaf Ln
- 121 Trailwood Dr
- 195 Cherokee Cir
- 133 Dechene Dr
- 13 Jaan Ct
- 115 Owl Hollow Rd Unit 12
- 285 Russell Rd
- 311 Russell Rd
- 94 Harrell Rd
- 286 Russell Rd
- 82 Harrell Rd
- 278 Russell Rd
- 252 Russell Rd
- 395 Russell Rd
- 988 County Farm Rd
- 244 Russell Rd
- 1024 County Farm Rd
- 380 Russell Rd
- 966 County Farm Rd
- 93 Harrell Rd
- 405 Russell Rd
- 928 County Farm Rd
- 1038 County Farm Rd
- 952 County Farm Rd
- 47 Vicky Ln
- 402 Russell Rd