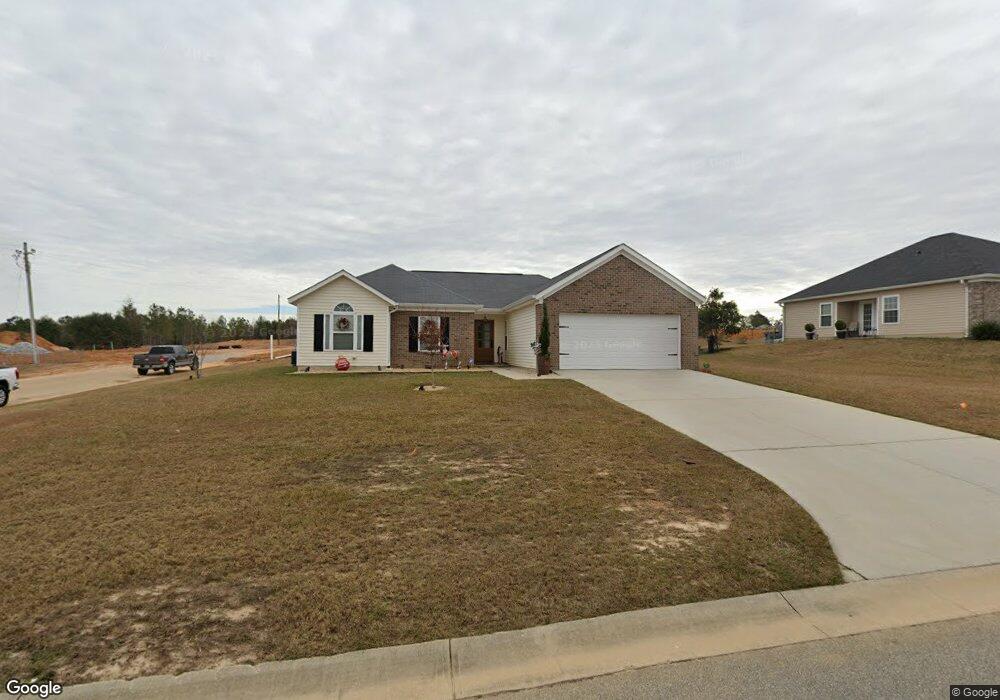
301 S Bridgeport Dr Statesboro, GA 30461
Estimated Value: $228,000 - $243,000
3
Beds
2
Baths
1,818
Sq Ft
$129/Sq Ft
Est. Value
About This Home
This home is located at 301 S Bridgeport Dr, Statesboro, GA 30461 and is currently estimated at $234,062, approximately $128 per square foot. 301 S Bridgeport Dr is a home located in Bulloch County with nearby schools including Statesboro High School, Mattie Lively Elementary School, and William James Middle School.
Ownership History
Date
Name
Owned For
Owner Type
Purchase Details
Closed on
Jul 26, 2019
Sold by
Anderson Maxine
Bought by
Solis Luis Pantoja
Current Estimated Value
Purchase Details
Closed on
Aug 13, 2018
Sold by
Henderson Ryan C
Bought by
Anderson Maxine and Tingle Kerri-Ann Cassandra
Home Financials for this Owner
Home Financials are based on the most recent Mortgage that was taken out on this home.
Original Mortgage
$123,025
Interest Rate
4.5%
Mortgage Type
New Conventional
Purchase Details
Closed on
May 24, 2017
Sold by
Hall James T
Bought by
Henderson Ryan C
Home Financials for this Owner
Home Financials are based on the most recent Mortgage that was taken out on this home.
Original Mortgage
$119,298
Interest Rate
4.12%
Mortgage Type
FHA
Purchase Details
Closed on
Apr 19, 2010
Sold by
Jennings Construction
Bought by
Hall James T
Home Financials for this Owner
Home Financials are based on the most recent Mortgage that was taken out on this home.
Original Mortgage
$123,000
Interest Rate
4.94%
Mortgage Type
New Conventional
Purchase Details
Closed on
Mar 21, 2007
Sold by
Not Provided
Bought by
Hall James T and Hall Winter
Create a Home Valuation Report for This Property
The Home Valuation Report is an in-depth analysis detailing your home's value as well as a comparison with similar homes in the area
Home Values in the Area
Average Home Value in this Area
Purchase History
| Date | Buyer | Sale Price | Title Company |
|---|---|---|---|
| Solis Luis Pantoja | $130,000 | -- | |
| Anderson Maxine | $129,500 | -- | |
| Henderson Ryan C | $121,500 | -- | |
| Hall James T | $123,000 | -- | |
| Hall James T | -- | -- |
Source: Public Records
Mortgage History
| Date | Status | Borrower | Loan Amount |
|---|---|---|---|
| Previous Owner | Anderson Maxine | $123,025 | |
| Previous Owner | Henderson Ryan C | $119,298 | |
| Previous Owner | Hall James T | $123,000 |
Source: Public Records
Tax History Compared to Growth
Tax History
| Year | Tax Paid | Tax Assessment Tax Assessment Total Assessment is a certain percentage of the fair market value that is determined by local assessors to be the total taxable value of land and additions on the property. | Land | Improvement |
|---|---|---|---|---|
| 2024 | $2,126 | $77,560 | $16,000 | $61,560 |
| 2023 | $1,873 | $65,400 | $8,000 | $57,400 |
| 2022 | $1,160 | $59,129 | $7,200 | $51,929 |
| 2021 | $1,009 | $50,035 | $7,200 | $42,835 |
| 2020 | $998 | $48,091 | $7,200 | $40,891 |
| 2019 | $918 | $43,999 | $5,720 | $38,279 |
| 2018 | $951 | $43,702 | $5,720 | $37,982 |
| 2017 | $928 | $42,133 | $5,720 | $36,413 |
| 2016 | $933 | $41,315 | $5,720 | $35,595 |
| 2015 | $916 | $40,375 | $5,720 | $34,655 |
| 2014 | $841 | $40,375 | $5,720 | $34,655 |
Source: Public Records
Map
Nearby Homes
- 0 Hwy 301 N Unit SA336324
- 0 Hwy 301 N Unit SA336320
- 350 S Bridgeport Dr
- 2066 Pinemount Blvd
- 105 Dodd Cir
- 2024 Pinemount Blvd
- 0 Lewis St Unit 10619137
- 103 Scotdale Ct
- 0 Green Ridge Ct Unit 40 8990863
- 113 Ladd Cir
- 0 E Main St Unit 10464174
- 317 Turner St
- 314 Somera Ln
- 316 Somera Ln
- 110 Hamner Dr
- 302 Somera Ln
- 315 Somera Ln
- 213 Manchester Dr Unit LOT 13
- 209 Manchester Dr Unit LOT 11
- 328 N Main St
- 161 S Bridgeport Dr
- NORTHBRIDGE No Availble Address Unit LOT 62
- NORTHBRIDGE No Availble Address Unit LOT 108
- NORTHBRIDGE No Availble Address Unit LOT 107
- NORTHBRIDGE No Availble Address Unit LOT 60
- 303 S Bridgeport Dr
- 200 N Bridgeport Dr
- 305 S Bridgeport Dr
- 110 Northbridge Dr
- 110 Northbridge Dr
- 102 Northbridge Dr Unit LOT 102
- 302 S Bridgeport Dr
- 160 S Bridgeport Dr
- 109 Northbridge Dr
- 61 Northbridge Dr
- 307 S Bridgeport Dr
- 202 N Bridgeport Dr Unit 10
- 202 N Bridgeport Dr
- 111 Northbridge Dr
- 304 S Bridgeport Dr