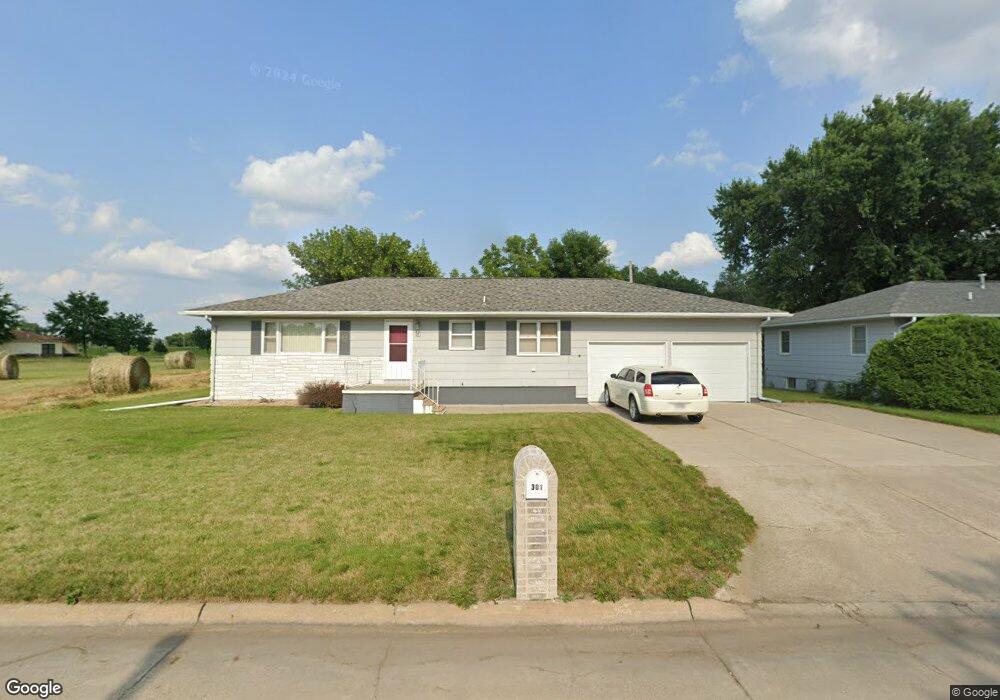
301 S Chestnut St Norfolk, NE 68701
Estimated Value: $241,356 - $285,000
3
Beds
2
Baths
1,176
Sq Ft
$227/Sq Ft
Est. Value
About This Home
This home is located at 301 S Chestnut St, Norfolk, NE 68701 and is currently estimated at $267,089, approximately $227 per square foot. 301 S Chestnut St is a home located in Madison County with nearby schools including Norfolk Senior High School, Keystone Christian Academy, and Christ Lutheran School.
Ownership History
Date
Name
Owned For
Owner Type
Purchase Details
Closed on
Aug 27, 2020
Sold by
Jones Robin M
Bought by
Jones Ward M
Current Estimated Value
Purchase Details
Closed on
Aug 30, 2007
Sold by
Ries Lois K
Bought by
Jones Ward M
Home Financials for this Owner
Home Financials are based on the most recent Mortgage that was taken out on this home.
Original Mortgage
$52,500
Outstanding Balance
$33,342
Interest Rate
6.72%
Mortgage Type
New Conventional
Estimated Equity
$233,747
Purchase Details
Closed on
Aug 20, 2007
Sold by
Ries Lois Kathryn and Janssen Diane Kay
Bought by
Jones Ward M
Home Financials for this Owner
Home Financials are based on the most recent Mortgage that was taken out on this home.
Original Mortgage
$52,500
Outstanding Balance
$33,342
Interest Rate
6.72%
Mortgage Type
New Conventional
Estimated Equity
$233,747
Purchase Details
Closed on
Oct 27, 2005
Sold by
Ries Lois Kautherine and Ries Lois Kathryn
Bought by
Ries Lois Kathryn
Home Financials for this Owner
Home Financials are based on the most recent Mortgage that was taken out on this home.
Original Mortgage
$80,000
Interest Rate
7.95%
Mortgage Type
Adjustable Rate Mortgage/ARM
Create a Home Valuation Report for This Property
The Home Valuation Report is an in-depth analysis detailing your home's value as well as a comparison with similar homes in the area
Home Values in the Area
Average Home Value in this Area
Purchase History
| Date | Buyer | Sale Price | Title Company |
|---|---|---|---|
| Jones Ward M | -- | None Available | |
| Jones Ward M | $92,500 | -- | |
| Jones Ward M | $93,000 | None Available | |
| Ries Lois Kathryn | -- | Missouri River Title |
Source: Public Records
Mortgage History
| Date | Status | Borrower | Loan Amount |
|---|---|---|---|
| Open | Jones Ward M | $52,500 | |
| Previous Owner | Ries Lois Kathryn | $80,000 |
Source: Public Records
Tax History Compared to Growth
Tax History
| Year | Tax Paid | Tax Assessment Tax Assessment Total Assessment is a certain percentage of the fair market value that is determined by local assessors to be the total taxable value of land and additions on the property. | Land | Improvement |
|---|---|---|---|---|
| 2024 | $3,503 | $205,446 | $12,105 | $193,341 |
| 2023 | $3,503 | $189,482 | $12,105 | $177,377 |
| 2022 | $3,199 | $170,477 | $12,105 | $158,372 |
| 2021 | $2,912 | $157,400 | $12,105 | $145,295 |
| 2020 | $2,682 | $145,403 | $12,105 | $133,298 |
| 2019 | $2,567 | $134,397 | $12,105 | $122,292 |
| 2018 | $2,495 | $132,818 | $10,526 | $122,292 |
| 2017 | $2,226 | $118,342 | $9,153 | $109,189 |
| 2016 | $2,084 | $110,600 | $8,554 | $102,046 |
| 2015 | $2,085 | $110,600 | $8,554 | $102,046 |
| 2014 | $2,053 | $105,741 | $8,554 | $97,187 |
| 2013 | $1,992 | $99,383 | $8,554 | $90,829 |
Source: Public Records
Map
Nearby Homes
- 910 S Chestnut St
- 605 E Park Ave
- 202 S Birch St
- 606 S Boxelder St
- 112 N Birch St
- 417 E Braasch Ave
- 403 E Norfolk Ave
- 310 N Boxelder St
- 501 E Pasewalk Ave
- 721 S Victory Rd
- 804 Volkman Dr
- 312 N Pine St
- 602 David Cir
- 513 David Cir
- 605 David St
- 603 David St
- 604 David St
- 702 Legacy Dr
- 704 Legacy Dr
- 706 Legacy Dr
- 303 S Chestnut St
- 300 Domar Dr
- 302 Domar Dr
- 208 S Chestnut St
- 300 S Chestnut St
- 305 S Chestnut St
- 206 S Chestnut St
- 304 Domar Dr
- 302 S Chestnut St
- 204 S Chestnut St
- 301 Domar Dr
- 303 Domar Dr
- 307 S Chestnut St
- 306 Domar Dr
- 305 Domar Dr
- 306 S Chestnut St
- 801 E Park Ave
- 301 S Willow St
- 209 S Willow St
- 307 Domar Dr