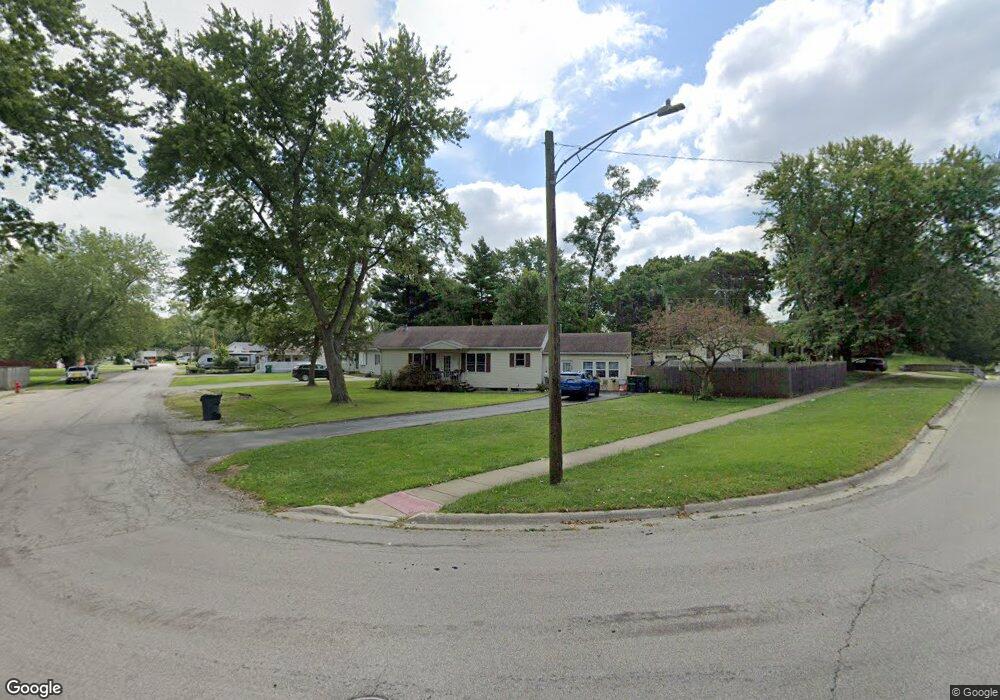
301 S Outer Dr Wilmington, IL 60481
Estimated Value: $199,000 - $264,000
--
Bed
--
Bath
--
Sq Ft
0.27
Acres
About This Home
This home is located at 301 S Outer Dr, Wilmington, IL 60481 and is currently estimated at $223,647. 301 S Outer Dr is a home located in Will County with nearby schools including Bruning Elementary School, L.J. Stevens Intermediate School, and Wilmington Middle School.
Ownership History
Date
Name
Owned For
Owner Type
Purchase Details
Closed on
Oct 6, 2021
Sold by
Bradley Thomas E and Bradley Nancy T
Bought by
Bradley Thomas E and Bradley Nancy T
Current Estimated Value
Home Financials for this Owner
Home Financials are based on the most recent Mortgage that was taken out on this home.
Original Mortgage
$131,200
Outstanding Balance
$100,622
Interest Rate
1.99%
Mortgage Type
New Conventional
Estimated Equity
$123,025
Purchase Details
Closed on
Jun 22, 1994
Sold by
White Wayne L and White Anita L
Bought by
Bradley Thomas B and Bradley Nancy T
Home Financials for this Owner
Home Financials are based on the most recent Mortgage that was taken out on this home.
Original Mortgage
$88,313
Interest Rate
8.78%
Mortgage Type
FHA
Purchase Details
Closed on
Nov 30, 1993
Sold by
Bockstahler Dorothy
Bought by
White Wayne L and White Anita L
Home Financials for this Owner
Home Financials are based on the most recent Mortgage that was taken out on this home.
Original Mortgage
$46,000
Interest Rate
6.95%
Create a Home Valuation Report for This Property
The Home Valuation Report is an in-depth analysis detailing your home's value as well as a comparison with similar homes in the area
Home Values in the Area
Average Home Value in this Area
Purchase History
| Date | Buyer | Sale Price | Title Company |
|---|---|---|---|
| Bradley Thomas E | -- | Stewart Title Guaranty Co | |
| Bradley Thomas B | $90,000 | -- | |
| White Wayne L | $46,000 | -- |
Source: Public Records
Mortgage History
| Date | Status | Borrower | Loan Amount |
|---|---|---|---|
| Open | Bradley Thomas E | $131,200 | |
| Previous Owner | Bradley Thomas B | $88,313 | |
| Previous Owner | White Wayne L | $46,000 |
Source: Public Records
Tax History Compared to Growth
Tax History
| Year | Tax Paid | Tax Assessment Tax Assessment Total Assessment is a certain percentage of the fair market value that is determined by local assessors to be the total taxable value of land and additions on the property. | Land | Improvement |
|---|---|---|---|---|
| 2024 | $2,726 | $57,000 | $14,777 | $42,223 |
| 2023 | $2,726 | $60,772 | $16,089 | $44,683 |
| 2022 | $3,633 | $55,032 | $14,569 | $40,463 |
| 2021 | $3,418 | $51,360 | $13,597 | $37,763 |
| 2020 | $3,356 | $50,010 | $13,240 | $36,770 |
| 2019 | $3,307 | $49,024 | $12,979 | $36,045 |
| 2018 | $3,397 | $47,907 | $12,683 | $35,224 |
| 2017 | $3,171 | $44,752 | $11,848 | $32,904 |
| 2016 | $2,860 | $41,114 | $10,885 | $30,229 |
| 2015 | $2,907 | $40,131 | $10,625 | $29,506 |
| 2014 | $2,907 | $40,536 | $10,732 | $29,804 |
| 2013 | $2,907 | $43,196 | $11,436 | $31,760 |
Source: Public Records
Map
Nearby Homes
- 905 N Joliet St
- 508 N Circle Dr
- 621 S Circle Dr
- 0 S Warner Bridge Rd
- 1517 Charlotte St
- 211 N Washington St
- LOT 7 Jennifer Ln
- LOT 6 Jennifer Ln
- 113 S Washington St
- 000 Rt 53 Hwy
- Lot 8 Kirsten Lee Dr
- 119 S Washington St
- 0000 Stevens Ln
- 625 W Baltimore St
- 30908 Slalom Ln
- 30900 Slalom Ln
- Parcel C Tommy Dr
- 31951 W River Rd
- 0000 Ryan St
- 711 Koala Ct
- 1009 N Kankakee St
- 305 S Outer Dr
- 302 S Outer Dr
- 304 S Outer Dr
- 306 S Outer Dr
- 309 S Outer Dr
- 1102 N Joliet St
- 1002 N Kankakee St
- 1004 N Joliet St
- 1002 N Joliet St
- 1006 N Kankakee St Unit 1
- 1103 N Kankakee St
- 919 N Kankakee St
- 1008 N Kankakee St
- 1106 N Joliet St
- 912 N Joliet St
- 1010 N Kankakee St
- 920 N Kankakee St
- 910 N Joliet St
- 1101 N Joliet St