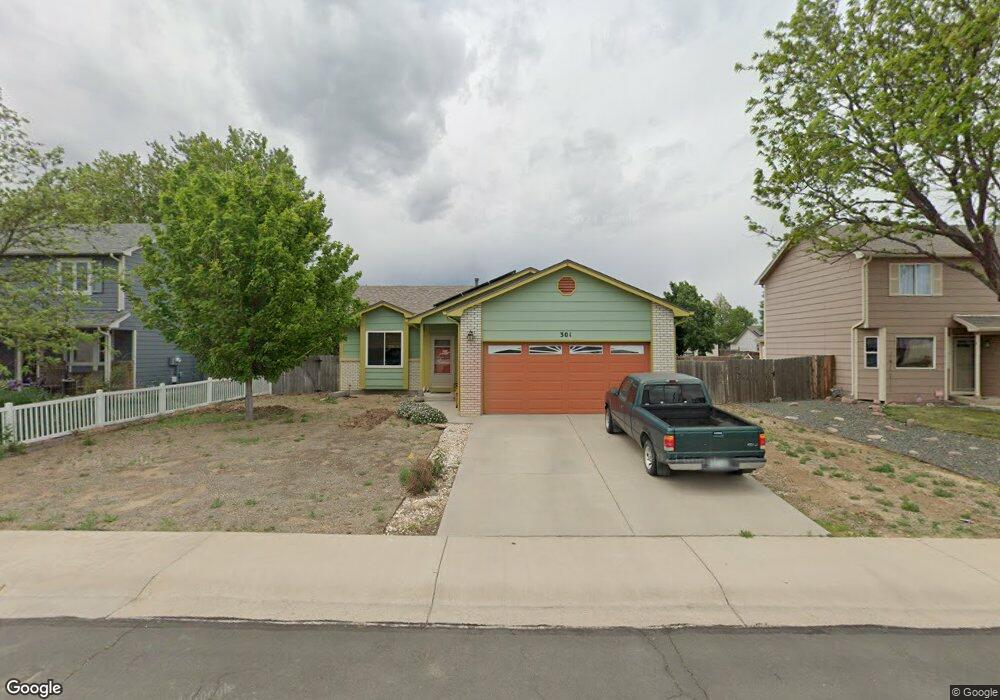
301 S Pauline Ave Milliken, CO 80543
Estimated Value: $373,000 - $440,000
3
Beds
2
Baths
1,784
Sq Ft
$230/Sq Ft
Est. Value
About This Home
This home is located at 301 S Pauline Ave, Milliken, CO 80543 and is currently estimated at $409,637, approximately $229 per square foot. 301 S Pauline Ave is a home located in Weld County with nearby schools including Milliken Elementary School, Milliken Middle School, and Roosevelt High School.
Ownership History
Date
Name
Owned For
Owner Type
Purchase Details
Closed on
Jun 8, 2007
Sold by
Beneficial Colorado Inc
Bought by
Portella Mitchell James
Current Estimated Value
Home Financials for this Owner
Home Financials are based on the most recent Mortgage that was taken out on this home.
Original Mortgage
$135,000
Outstanding Balance
$82,071
Interest Rate
6.16%
Mortgage Type
VA
Estimated Equity
$327,566
Purchase Details
Closed on
Mar 14, 2007
Sold by
Gutierrez Jose M and Gutierrez Margie L
Bought by
Beneficial Mortgage Co Of Colorado
Purchase Details
Closed on
Dec 8, 1995
Sold by
Rust Construction Inc
Bought by
Gutierrez Jose M and Gutierrez Margie L
Purchase Details
Closed on
Mar 6, 1995
Sold by
Seele Walter F
Bought by
Rust Construction Inc
Purchase Details
Closed on
Oct 11, 1984
Bought by
Seele Walter F
Create a Home Valuation Report for This Property
The Home Valuation Report is an in-depth analysis detailing your home's value as well as a comparison with similar homes in the area
Home Values in the Area
Average Home Value in this Area
Purchase History
| Date | Buyer | Sale Price | Title Company |
|---|---|---|---|
| Portella Mitchell James | $135,000 | Fahtco | |
| Beneficial Mortgage Co Of Colorado | -- | None Available | |
| Gutierrez Jose M | $97,500 | -- | |
| Rust Construction Inc | $160,000 | -- | |
| Seele Walter F | -- | -- |
Source: Public Records
Mortgage History
| Date | Status | Borrower | Loan Amount |
|---|---|---|---|
| Open | Portella Mitchell James | $135,000 |
Source: Public Records
Tax History Compared to Growth
Tax History
| Year | Tax Paid | Tax Assessment Tax Assessment Total Assessment is a certain percentage of the fair market value that is determined by local assessors to be the total taxable value of land and additions on the property. | Land | Improvement |
|---|---|---|---|---|
| 2025 | $1,608 | $26,240 | $5,880 | $20,360 |
| 2024 | $1,608 | $26,240 | $5,880 | $20,360 |
| 2023 | $1,642 | $26,910 | $5,410 | $21,500 |
| 2022 | $1,639 | $20,980 | $4,380 | $16,600 |
| 2021 | $1,770 | $21,580 | $4,500 | $17,080 |
| 2020 | $1,510 | $19,720 | $3,580 | $16,140 |
| 2019 | $1,859 | $19,720 | $3,580 | $16,140 |
| 2018 | $1,548 | $16,040 | $2,810 | $13,230 |
| 2017 | $1,549 | $16,040 | $2,810 | $13,230 |
| 2016 | $1,332 | $13,660 | $2,270 | $11,390 |
| 2015 | $1,354 | $13,660 | $2,270 | $11,390 |
| 2014 | $965 | $9,850 | $2,390 | $7,460 |
Source: Public Records
Map
Nearby Homes
- 300 S Quentine Ave
- 226 W Forest St
- 105 S Laura Ave
- 204 N Olive Ave
- 944 S Lilac Ct
- 209 S Josephine Ave
- 103 N Josephine Ave Unit LOT 36
- 218 S Josephine Ave
- 280 E Katsura St
- 140 E Lilac St
- 381 E Mountain Ash St
- 0 Broad St Unit RECIR992751
- 0 Broad St Unit RECIR992750
- 1130 S Marjorie Ave
- 113 S Frances Ave
- 208 S Frances Ave
- 23395 State Highway 257
- 1530 S Haymaker Dr
- 0 S Cora Ave
- 622 Traildust Dr
- 303 S Pauline Ave
- 211 S Pauline Ave
- 305 S Pauline Ave
- 209 S Pauline Ave
- 302 S Quentine Ave
- 210 S Quentine Ave
- 304 S Quentine Ave
- 208 S Quentine Ave
- 300 S Pauline Ave
- 307 S Pauline Ave
- 302 S Pauline Ave
- 207 S Pauline Ave
- 304 S Pauline Ave
- 206 S Quentine Ave
- 60 County Road 23
- 309 S Pauline Ave
- 205 S Pauline Ave
- 306 S Pauline Ave
- 308 S Quentine Ave
- 204 S Quentine Ave