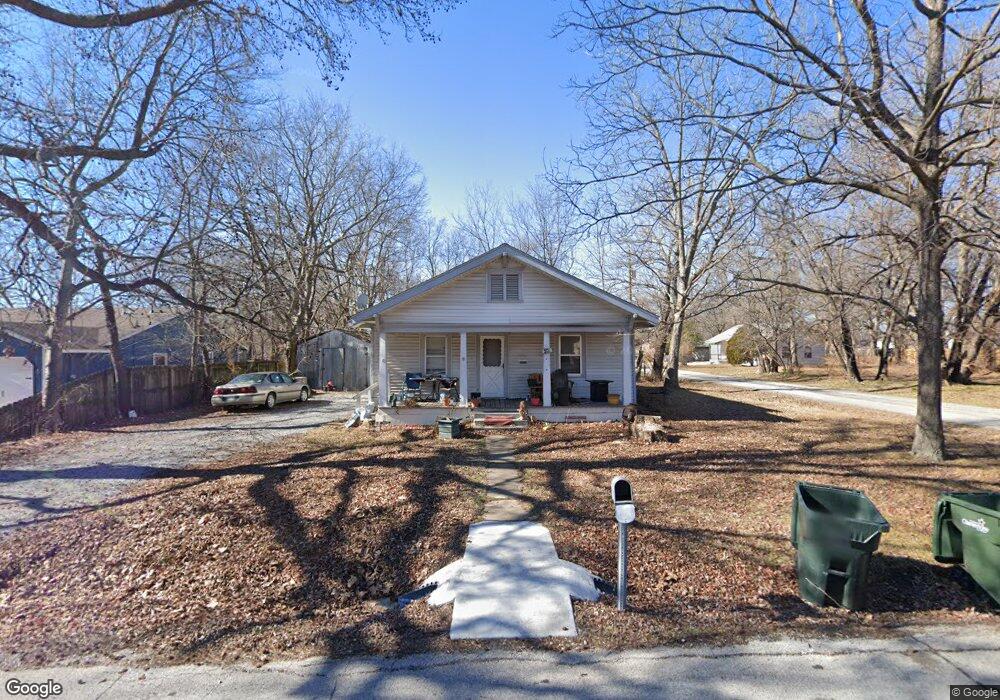
301 S Perdue Ave Claremore, OK 74017
Estimated Value: $119,725 - $144,000
2
Beds
1
Bath
1,008
Sq Ft
$128/Sq Ft
Est. Value
About This Home
This home is located at 301 S Perdue Ave, Claremore, OK 74017 and is currently estimated at $129,431, approximately $128 per square foot. 301 S Perdue Ave is a home located in Rogers County with nearby schools including Claremont Elementary School, Will Rogers Junior High School, and Claremore High School.
Ownership History
Date
Name
Owned For
Owner Type
Purchase Details
Closed on
Aug 29, 2024
Sold by
Choat Properties Llc
Bought by
Wear Cynthia
Current Estimated Value
Home Financials for this Owner
Home Financials are based on the most recent Mortgage that was taken out on this home.
Original Mortgage
$67,900
Outstanding Balance
$67,048
Interest Rate
6.73%
Mortgage Type
New Conventional
Estimated Equity
$62,383
Purchase Details
Closed on
May 16, 2019
Sold by
Bto Properties Llc
Bought by
Choat Properties Llc
Purchase Details
Closed on
Jul 21, 2003
Sold by
Owens Michael Joseph
Create a Home Valuation Report for This Property
The Home Valuation Report is an in-depth analysis detailing your home's value as well as a comparison with similar homes in the area
Home Values in the Area
Average Home Value in this Area
Purchase History
| Date | Buyer | Sale Price | Title Company |
|---|---|---|---|
| Wear Cynthia | $70,000 | None Listed On Document | |
| Choat Properties Llc | -- | None Available | |
| -- | -- | -- |
Source: Public Records
Mortgage History
| Date | Status | Borrower | Loan Amount |
|---|---|---|---|
| Open | Wear Cynthia | $67,900 |
Source: Public Records
Tax History Compared to Growth
Tax History
| Year | Tax Paid | Tax Assessment Tax Assessment Total Assessment is a certain percentage of the fair market value that is determined by local assessors to be the total taxable value of land and additions on the property. | Land | Improvement |
|---|---|---|---|---|
| 2025 | $650 | $12,173 | $7,063 | $5,110 |
| 2024 | $650 | $7,034 | $2,236 | $4,798 |
| 2023 | $650 | $6,699 | $1,969 | $4,730 |
| 2022 | $591 | $6,380 | $1,547 | $4,833 |
| 2021 | $545 | $6,167 | $1,547 | $4,620 |
| 2020 | $547 | $6,237 | $1,547 | $4,690 |
| 2019 | $527 | $5,692 | $1,547 | $4,145 |
| 2018 | $559 | $6,045 | $1,547 | $4,498 |
| 2017 | $545 | $5,930 | $1,547 | $4,383 |
| 2016 | $530 | $5,647 | $1,547 | $4,100 |
| 2015 | $499 | $5,379 | $1,547 | $3,832 |
| 2014 | $475 | $5,122 | $1,547 | $3,575 |
Source: Public Records
Map
Nearby Homes
- 402 E Patti Page Blvd
- 417 E Will Rogers Blvd
- 321 E Patti Page Blvd
- 16111 Oklahoma 88
- 317 E 4th St
- 221 N Dorothy Ave
- 522 E 6th St
- 520 E 6th St
- 507 S Maryland Ave
- 202 W 4th St
- 203 W 9th St S
- 809 S Muskogee Ave
- 121 W 9th Place S
- 104 W 7th St
- 1012 N Osage Ave
- 419 E 12th St
- 21755 Country Ridge Ln
- 103 E 12th Place
- 119 N Missouri Ave
- 1119 N Oklahoma Ave
- 305 S Perdue Ave
- 495 Claremore Rt 9
- 485 E Claremore St
- 483 Claremore Rt 5
- 715 Claremore Rt 2
- 1853 Claremore Rr
- 733.B Claremore Rt 2
- 141551 E Claremore Rt 1
- 7303 E Claremore Rt 8
- 707.A Claremore Rt 2
- 715-T Claremore Rt 2
- 477 E Claremore St
- 473 E Claremore St
- 469 E Claremore St
- 495 E Claremore St
- 307 S Perdue Ave
- 465 E Claremore St
- 461 E Claremore St
- 498 E Claremore St
- 451 Claremore Rt 8