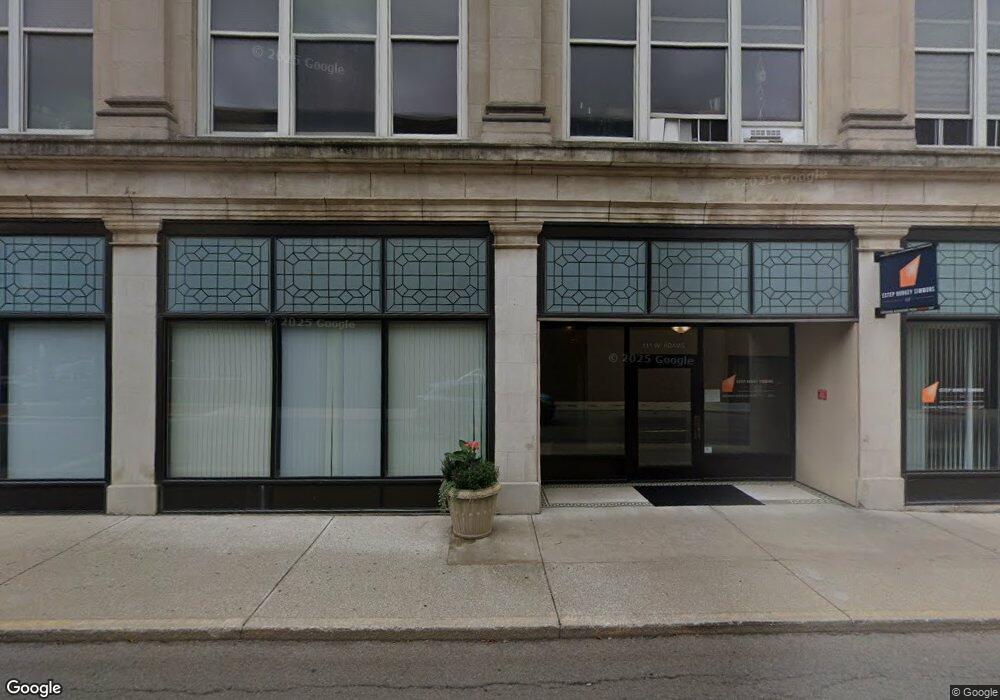
301 S Walnut St Unit 202 Muncie, IN 47305
Downtown Muncie NeighborhoodEstimated Value: $101,000 - $131,000
1
Bed
1
Bath
830
Sq Ft
$143/Sq Ft
Est. Value
About This Home
This home is located at 301 S Walnut St Unit 202, Muncie, IN 47305 and is currently estimated at $118,387, approximately $142 per square foot. 301 S Walnut St Unit 202 is a home located in Delaware County with nearby schools including Muncie Central High School, South View Elementary School, and Northside Middle School.
Ownership History
Date
Name
Owned For
Owner Type
Purchase Details
Closed on
Jul 12, 2023
Sold by
Spradlin Allison M
Bought by
Marsh Robert W
Current Estimated Value
Purchase Details
Closed on
Oct 13, 2006
Sold by
Lofts At Mitehell Place Llc
Bought by
Demaree Allison M
Home Financials for this Owner
Home Financials are based on the most recent Mortgage that was taken out on this home.
Original Mortgage
$61,600
Interest Rate
6.49%
Mortgage Type
Adjustable Rate Mortgage/ARM
Create a Home Valuation Report for This Property
The Home Valuation Report is an in-depth analysis detailing your home's value as well as a comparison with similar homes in the area
Home Values in the Area
Average Home Value in this Area
Purchase History
| Date | Buyer | Sale Price | Title Company |
|---|---|---|---|
| Marsh Robert W | -- | None Listed On Document | |
| Demaree Allison M | -- | None Available |
Source: Public Records
Mortgage History
| Date | Status | Borrower | Loan Amount |
|---|---|---|---|
| Previous Owner | Demaree Allison M | $61,600 |
Source: Public Records
Tax History Compared to Growth
Tax History
| Year | Tax Paid | Tax Assessment Tax Assessment Total Assessment is a certain percentage of the fair market value that is determined by local assessors to be the total taxable value of land and additions on the property. | Land | Improvement |
|---|---|---|---|---|
| 2024 | $791 | $68,300 | $16,400 | $51,900 |
| 2023 | $791 | $68,300 | $16,400 | $51,900 |
| 2022 | $1,474 | $68,300 | $16,400 | $51,900 |
| 2021 | $1,446 | $66,900 | $15,000 | $51,900 |
| 2020 | $1,446 | $66,900 | $15,000 | $51,900 |
| 2019 | $1,446 | $66,900 | $15,000 | $51,900 |
| 2018 | $1,446 | $66,900 | $15,000 | $51,900 |
| 2017 | $1,366 | $62,900 | $15,000 | $47,900 |
| 2016 | $1,366 | $62,900 | $15,000 | $47,900 |
| 2014 | $1,373 | $66,500 | $15,000 | $51,500 |
| 2013 | -- | $66,500 | $15,000 | $51,500 |
Source: Public Records
Map
Nearby Homes
- 114 S Walnut St
- 114 S Walnut St Unit 100 & 200
- 113 E Main St
- 407 W Adams St
- 415 W Howard St
- 27 W Orchard Place
- 616 E Charles St
- 725 W Charles St
- 502 S Mound St
- 303 S Proud St
- 305 S Proud St
- 1011 S Elm St
- 216 N Vine St
- 709 S Vine St
- 719 N Mulberry St
- 800-802 N Jefferson St
- 518 S Elliott St
- 825 E Washington St
- 320 N Vine St
- 925 W Powers St
- 301 S Walnut St
- 301 S Walnut St
- 301 S Walnut St Unit 308
- 301 S Walnut St Unit 306
- 301 S Walnut St Unit 207
- 301 S Walnut St
- 301 S Walnut St Unit 301
- 301 S Walnut St Unit 207
- 301 S Walnut St
- 301 S Walnut St Unit The Lofts @ Mitchell
- 301 S Walnut St
- 301 S Walnut St
- 301 S Walnut St
- 301 S Walnut St
- 301 S Walnut St Unit 305
- 301 S Walnut St Unit 204
- 301 S Walnut St Unit 206
- 301 S Walnut St
- 301 S Walnut St
- 301 S Walnut St