Estimated Value: $277,945 - $309,000
4
Beds
3
Baths
2,252
Sq Ft
$128/Sq Ft
Est. Value
About This Home
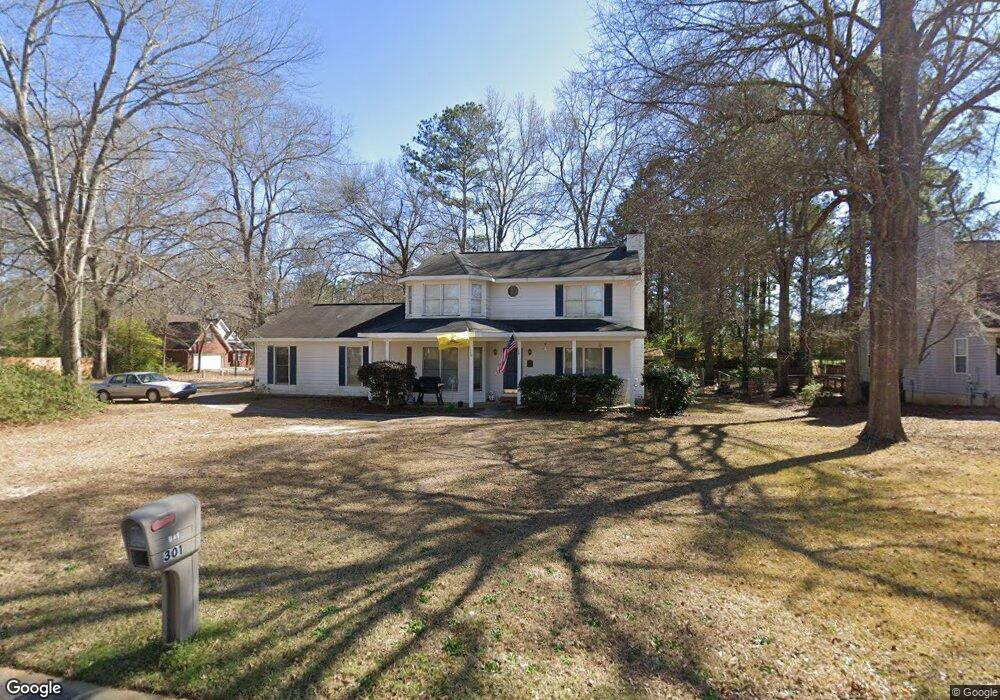
This home is located at 301 Shane Cir, Perry, GA 31069 and is currently estimated at $288,236, approximately $127 per square foot. 301 Shane Cir is a home located in Houston County with nearby schools including Tucker Elementary School, Perry Middle School, and Perry High School.
Ownership History
Date
Name
Owned For
Owner Type
Purchase Details
Closed on
Apr 27, 2009
Sold by
Hooper Robert and Hooper Ronda
Bought by
Hooper Robert L and Hooper Ronda M
Current Estimated Value
Home Financials for this Owner
Home Financials are based on the most recent Mortgage that was taken out on this home.
Original Mortgage
$104,500
Outstanding Balance
$64,337
Interest Rate
4.86%
Mortgage Type
Stand Alone Refi Refinance Of Original Loan
Estimated Equity
$223,900
Purchase Details
Closed on
May 26, 2000
Sold by
Mcgehee Thomas I and Mcgehee Audrey L
Bought by
Hooper Robert and Hooper Ronda*
Purchase Details
Closed on
May 15, 1996
Sold by
Reid Raymond K and Reid Janna M
Bought by
Mcgehee Thomas I and Mcgehee Audrey L
Purchase Details
Closed on
Aug 11, 1994
Sold by
Wilson Keith Z and Wilson Monica M
Bought by
Reid Raymond K and Reid Janna M
Purchase Details
Closed on
Nov 4, 1992
Sold by
Pete Stokes Builders Inc
Bought by
Wilson Keith Z and Wilson Monica M
Purchase Details
Closed on
Dec 29, 1989
Sold by
Stokes W F
Bought by
Pete Stokes Builders Inc
Create a Home Valuation Report for This Property
The Home Valuation Report is an in-depth analysis detailing your home's value as well as a comparison with similar homes in the area
Home Values in the Area
Average Home Value in this Area
Purchase History
| Date | Buyer | Sale Price | Title Company |
|---|---|---|---|
| Hooper Robert L | -- | None Available | |
| Hooper Robert | $106,000 | -- | |
| Mcgehee Thomas I | $92,900 | -- | |
| Reid Raymond K | $92,000 | -- | |
| Wilson Keith Z | $86,000 | -- | |
| Pete Stokes Builders Inc | -- | -- |
Source: Public Records
Mortgage History
| Date | Status | Borrower | Loan Amount |
|---|---|---|---|
| Open | Hooper Robert L | $104,500 |
Source: Public Records
Tax History
| Year | Tax Paid | Tax Assessment Tax Assessment Total Assessment is a certain percentage of the fair market value that is determined by local assessors to be the total taxable value of land and additions on the property. | Land | Improvement |
|---|---|---|---|---|
| 2025 | $2,564 | $78,000 | $10,000 | $68,000 |
| 2024 | $2,816 | $76,640 | $10,000 | $66,640 |
| 2023 | $2,335 | $63,120 | $10,000 | $53,120 |
| 2022 | $1,301 | $56,600 | $8,000 | $48,600 |
| 2021 | $1,185 | $51,280 | $8,000 | $43,280 |
| 2020 | $1,163 | $50,080 | $8,000 | $42,080 |
| 2019 | $1,163 | $50,080 | $8,000 | $42,080 |
| 2018 | $1,163 | $50,080 | $8,000 | $42,080 |
| 2017 | $1,165 | $50,080 | $8,000 | $42,080 |
| 2016 | $1,166 | $50,080 | $8,000 | $42,080 |
| 2015 | $1,169 | $50,080 | $8,000 | $42,080 |
| 2014 | -- | $50,080 | $8,000 | $42,080 |
| 2013 | -- | $50,080 | $8,000 | $42,080 |
Source: Public Records
Map
Nearby Homes
- 1423 Tucker Rd
- 528 Ansley Ave
- 614 Hillcrest Ave
- 625 Cooper St
- 624 Pine Ridge St
- 634 Pine Ridge St
- 1432 Duncan Ave
- 1207 Tucker Rd
- 117 Constance Ct
- 118 Constance Ct
- 903 Massee Ln
- 1 Pleasant Oaks Dr
- 3 Pleasant Oaks Dr
- 107 Water Run Way
- 214 Farmland Cir
- 203 Farrell Way
- 214 Farmland Cir Unit LOT 8 AG
- 4 Pleasant Oak Dr
- 2 Pleasant Oaks Dr
- 0 Carroll Aly
- 103 Quinelle Dr
- 305 Shane Cir
- 302 Shane Cir
- 216 Shane Cir
- 300 Shane Cir
- 102 Quinelle Dr
- 105 Quinelle Dr
- 304 Shane Cir
- 304 Christopher Luke Cir
- 302 Christopher Luke Cir
- 207 Shane Cir
- 104 Quinelle Dr Unit 43
- 104 Quinelle Dr
- 307 Shane Cir
- 306 Shane Cir
- 107 Quinelle Dr
- 201 Shane Cir
- 306 Christopher Luke Cir
- 203 Shane Cir
- 106 Quinelle Dr
Your Personal Tour Guide
Ask me questions while you tour the home.