Estimated Value: $357,565 - $400,000
3
Beds
2
Baths
1,847
Sq Ft
$205/Sq Ft
Est. Value
About This Home
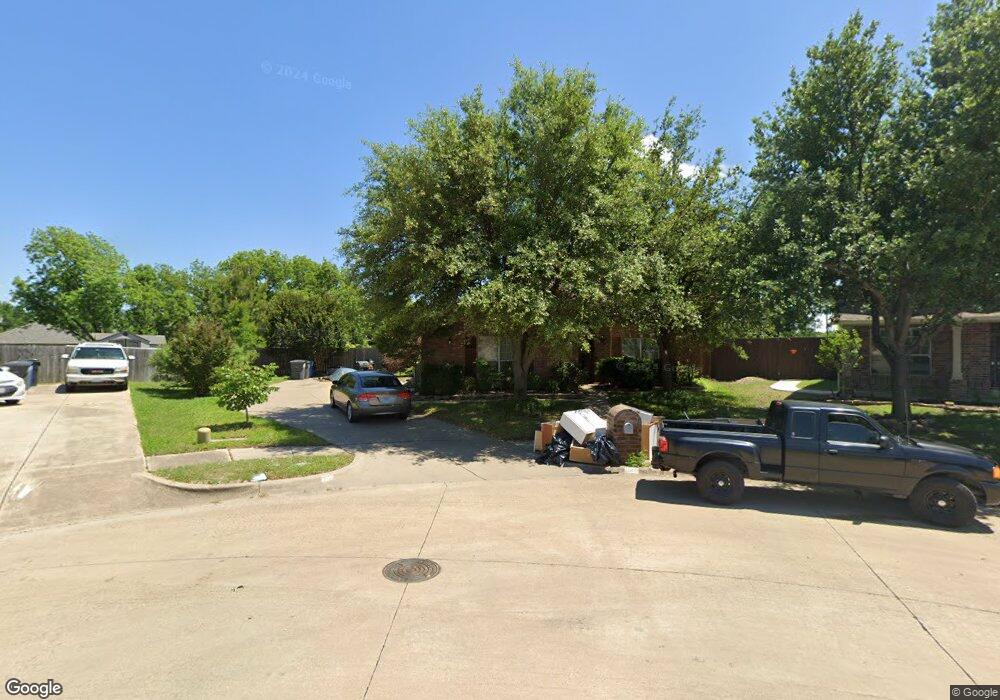
This home is located at 301 Sikorsky Ct, Wylie, TX 75098 and is currently estimated at $379,141, approximately $205 per square foot. 301 Sikorsky Ct is a home located in Collin County with nearby schools including T.F. Birmingham Elementary School, Frank Mcmillan Junior High School, and Davis Intermediate School.
Ownership History
Date
Name
Owned For
Owner Type
Purchase Details
Closed on
Jan 4, 2017
Sold by
Reeder Zane and Reeder Lindsay
Bought by
Mccune Janice L and Janice L Mccune Trust
Current Estimated Value
Purchase Details
Closed on
Jun 30, 2015
Sold by
Robinson Clifford and Robinson Cathy
Bought by
Reeder Lindsey and Reeder Zane
Home Financials for this Owner
Home Financials are based on the most recent Mortgage that was taken out on this home.
Original Mortgage
$199,500
Interest Rate
3.9%
Purchase Details
Closed on
Aug 30, 2006
Sold by
Rah Of Texas Lp
Bought by
Robinson Clifford and Robinson Cathy
Home Financials for this Owner
Home Financials are based on the most recent Mortgage that was taken out on this home.
Original Mortgage
$147,821
Interest Rate
6.72%
Create a Home Valuation Report for This Property
The Home Valuation Report is an in-depth analysis detailing your home's value as well as a comparison with similar homes in the area
Home Values in the Area
Average Home Value in this Area
Purchase History
| Date | Buyer | Sale Price | Title Company |
|---|---|---|---|
| Mccune Janice L | -- | None Available | |
| Reeder Lindsey | -- | Reunion Title | |
| Robinson Clifford | -- | Capital Title Of Texas Llc |
Source: Public Records
Mortgage History
| Date | Status | Borrower | Loan Amount |
|---|---|---|---|
| Previous Owner | Reeder Lindsey | $199,500 | |
| Previous Owner | Robinson Clifford | $147,821 |
Source: Public Records
Tax History Compared to Growth
Tax History
| Year | Tax Paid | Tax Assessment Tax Assessment Total Assessment is a certain percentage of the fair market value that is determined by local assessors to be the total taxable value of land and additions on the property. | Land | Improvement |
|---|---|---|---|---|
| 2025 | $7,527 | $355,858 | $103,500 | $252,358 |
| 2024 | $7,527 | $381,085 | $103,500 | $277,585 |
| 2023 | $7,527 | $374,969 | $98,325 | $276,644 |
| 2022 | $7,824 | $356,611 | $98,325 | $258,286 |
| 2021 | $6,296 | $267,603 | $72,450 | $195,153 |
| 2020 | $6,390 | $257,344 | $67,275 | $190,069 |
| 2019 | $6,098 | $232,037 | $67,275 | $164,762 |
| 2018 | $6,718 | $249,454 | $62,100 | $187,354 |
| 2017 | $6,367 | $236,420 | $62,100 | $174,320 |
| 2016 | $5,447 | $196,022 | $44,505 | $151,517 |
| 2015 | $3,895 | $166,101 | $39,330 | $126,771 |
| 2014 | $3,895 | $146,627 | $0 | $0 |
Source: Public Records
Map
Nearby Homes
- 309 Sikorsky Ct
- 307 W Brown St
- 415 Carver Dr
- 404 W Jefferson St
- 111 N Keefer Dr
- 410 N Winding Oaks Dr
- 303 N 2nd St
- 1022 Debby Ct
- 423 N Winding Oaks Dr
- 420 W Oak St
- 107 N Winding Oaks Dr
- 205 S Cottonbelt Ave
- 300 S Cottonbelt Ave Unit 3A
- 517 E Gaston Dr
- 502 E Gaston Dr
- 115 Pullman Place
- 104 N 5th St
- 121 Fairmount Dr
- 500 Parker Rd
- 301 S 3rd St
- 303 Sikorsky Ct
- 400 Carver Dr
- 305 Sikorsky Ct
- 402 Carver Dr
- 300 Sikorsky Ct
- 407 N Jackson Ave Unit A
- 407 N Jackson Ave Unit B
- 307 Sikorsky Ct
- 409 N Jackson Ave Unit B
- 409 N Jackson Ave Unit A
- 401 N Keefer Dr
- 404 Carver Dr
- 302 Sikorsky Ct
- 405 N Jackson Ave Unit B
- 405 N Jackson Ave Unit A
- 411 N Jackson Ave
- 411 N Jackson Ave
- 411 N Jackson Ave Unit B
- 300 W Brown St
- 413 N Jackson Ave