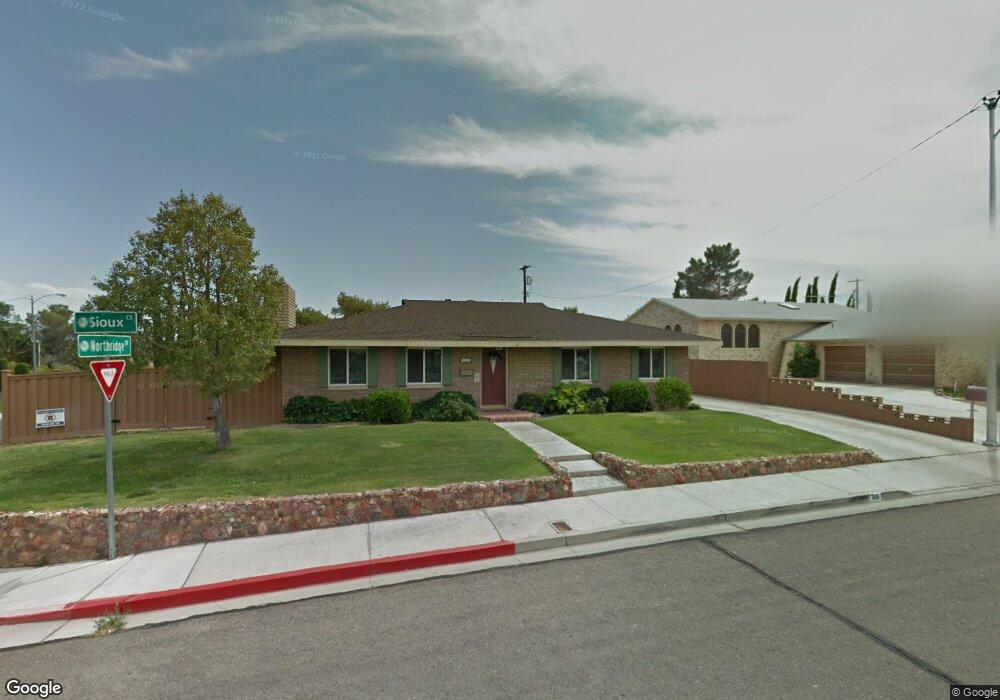
301 Sioux Ct Boulder City, NV 89005
Estimated Value: $525,000 - $618,000
3
Beds
2
Baths
2,132
Sq Ft
$260/Sq Ft
Est. Value
About This Home
This home is located at 301 Sioux Ct, Boulder City, NV 89005 and is currently estimated at $553,617, approximately $259 per square foot. 301 Sioux Ct is a home located in Clark County with nearby schools including Andrew Mitchell Elementary School, Martha P. King Elementary School, and Elton M. & Madelaine E. Garrett Junior High School.
Ownership History
Date
Name
Owned For
Owner Type
Purchase Details
Closed on
May 21, 2010
Sold by
Simkins Kenneth A and Simkins Donlee
Bought by
Simkins 1975 Trust
Current Estimated Value
Create a Home Valuation Report for This Property
The Home Valuation Report is an in-depth analysis detailing your home's value as well as a comparison with similar homes in the area
Home Values in the Area
Average Home Value in this Area
Purchase History
| Date | Buyer | Sale Price | Title Company |
|---|---|---|---|
| Simkins 1975 Trust | -- | None Available |
Source: Public Records
Tax History Compared to Growth
Tax History
| Year | Tax Paid | Tax Assessment Tax Assessment Total Assessment is a certain percentage of the fair market value that is determined by local assessors to be the total taxable value of land and additions on the property. | Land | Improvement |
|---|---|---|---|---|
| 2025 | $1,681 | $92,677 | $52,500 | $40,177 |
| 2024 | $1,681 | $92,677 | $52,500 | $40,177 |
| 2023 | $1,681 | $75,875 | $39,900 | $35,975 |
| 2022 | $1,556 | $67,405 | $35,000 | $32,405 |
| 2021 | $1,441 | $65,094 | $35,000 | $30,094 |
| 2020 | $1,338 | $58,289 | $29,050 | $29,239 |
| 2019 | $1,254 | $56,873 | $28,700 | $28,173 |
| 2018 | $1,197 | $55,307 | $28,700 | $26,607 |
| 2017 | $1,240 | $47,482 | $21,000 | $26,482 |
| 2016 | $1,119 | $46,485 | $21,000 | $25,485 |
| 2015 | $1,117 | $42,029 | $17,500 | $24,529 |
| 2014 | $1,082 | $41,468 | $17,500 | $23,968 |
Source: Public Records
Map
Nearby Homes
- 627 Don Vincente Dr
- 511 Northridge Dr
- Windsor Plan at Heritage Peak
- Somerset Plan at Heritage Peak
- 1095 Endora Way
- 517 5th St
- 632 Paloma Dr
- 1104 Endora Way
- 524 5th St
- 394 Arizona St
- 531 New Mexico St
- 1115 Endora Way
- 639 I Ave
- 1120 Fuente Way
- 557 6th St
- 633 5th St
- 617 6th St
- 1115 Mariposa Way
- 1126 Azul Way
- 650 Arizona St