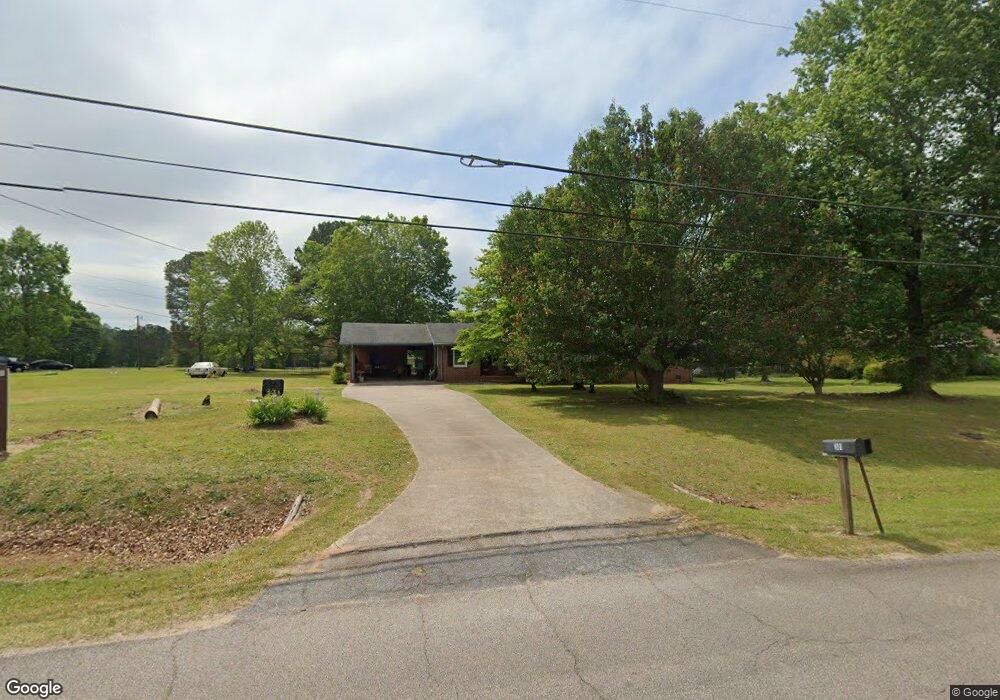
301 Sivell Rd Lagrange, GA 30241
Estimated Value: $254,000 - $299,000
4
Beds
3
Baths
1,892
Sq Ft
$144/Sq Ft
Est. Value
About This Home
This home is located at 301 Sivell Rd, Lagrange, GA 30241 and is currently estimated at $272,592, approximately $144 per square foot. 301 Sivell Rd is a home located in Troup County with nearby schools including Callaway Elementary School, Hogansville Elementary School, and Callaway Middle School.
Ownership History
Date
Name
Owned For
Owner Type
Purchase Details
Closed on
May 28, 1999
Sold by
Klehn David and Klehn Carol
Bought by
Copeland Robert L and Copeland Helen W
Current Estimated Value
Purchase Details
Closed on
Oct 2, 1990
Sold by
Jones William and Jones Suzanne T
Bought by
Klehn David and Klehn Carol
Purchase Details
Closed on
May 6, 1978
Sold by
Karen Mark and Karen Hanson
Bought by
Jones William and Jones Suzanne T
Purchase Details
Closed on
Jul 12, 1976
Sold by
Looney James C and Looney Levonia O
Bought by
Karen Mark and Karen Hanson
Purchase Details
Closed on
Sep 16, 1975
Sold by
Jerry R & Linda L Garden
Bought by
Looney James C and Looney Levonia O
Purchase Details
Closed on
Jan 1, 1973
Sold by
Mattie Leo R and Mattie Lou Lewis
Bought by
Jerry R & Linda L Garden
Purchase Details
Closed on
Jan 1, 1972
Sold by
Bales Bales and Bales Messer
Bought by
Mattie Leo R and Mattie Lou Lewis
Purchase Details
Closed on
Jan 1, 1971
Bought by
Bales Bales and Bales Messer
Create a Home Valuation Report for This Property
The Home Valuation Report is an in-depth analysis detailing your home's value as well as a comparison with similar homes in the area
Purchase History
| Date | Buyer | Sale Price | Title Company |
|---|---|---|---|
| Copeland Robert L | $98,000 | -- | |
| Klehn David | $77,000 | -- | |
| Jones William | -- | -- | |
| Karen Mark | -- | -- | |
| Looney James C | -- | -- | |
| Jerry R & Linda L Garden | -- | -- | |
| Mattie Leo R | -- | -- | |
| Bales Bales | -- | -- |
Source: Public Records
Tax History
| Year | Tax Paid | Tax Assessment Tax Assessment Total Assessment is a certain percentage of the fair market value that is determined by local assessors to be the total taxable value of land and additions on the property. | Land | Improvement |
|---|---|---|---|---|
| 2025 | $2,543 | $95,440 | $10,000 | $85,440 |
| 2024 | $2,531 | $94,800 | $10,000 | $84,800 |
| 2023 | $1,854 | $87,880 | $10,000 | $77,880 |
| 2022 | $2,262 | $83,040 | $10,000 | $73,040 |
| 2021 | $1,800 | $61,680 | $8,000 | $53,680 |
| 2020 | $1,800 | $61,680 | $8,000 | $53,680 |
| 2019 | $1,495 | $51,560 | $4,800 | $46,760 |
| 2018 | $1,324 | $45,880 | $4,800 | $41,080 |
| 2017 | $1,324 | $45,880 | $4,800 | $41,080 |
| 2016 | $1,285 | $44,600 | $4,800 | $39,800 |
| 2015 | $1,288 | $44,600 | $4,800 | $39,800 |
| 2014 | $1,226 | $42,505 | $4,800 | $37,705 |
| 2013 | -- | $41,939 | $4,800 | $37,139 |
Source: Public Records
Map
Nearby Homes
- 90 Beaver Run
- 125 Hazel Way
- 119 Sir Lancelot St
- SMOKEMONT Smokemont Dr
- 124 Woodridge Cir
- 10 Whitfield Rd
- 300 Old Pond Rd
- 200 Freshwater Ct Unit 37
- 242 River Meadow Dr
- 249 River Meadow Dr
- 202 Freshwater Ct
- 402 Sweetwood Ct Unit LOT 2
- 204 Freshwater Ct
- 206 Freshwater Ct Unit 34E
- 206 Freshwater Ct
- 200 River Meadow Dr
- 124 Shenandoah Ln
- 114 Shenandoah Ln
- 106 Shenandoah Ln Unit 26E
- 106 Shenandoah Ln
Your Personal Tour Guide
Ask me questions while you tour the home.