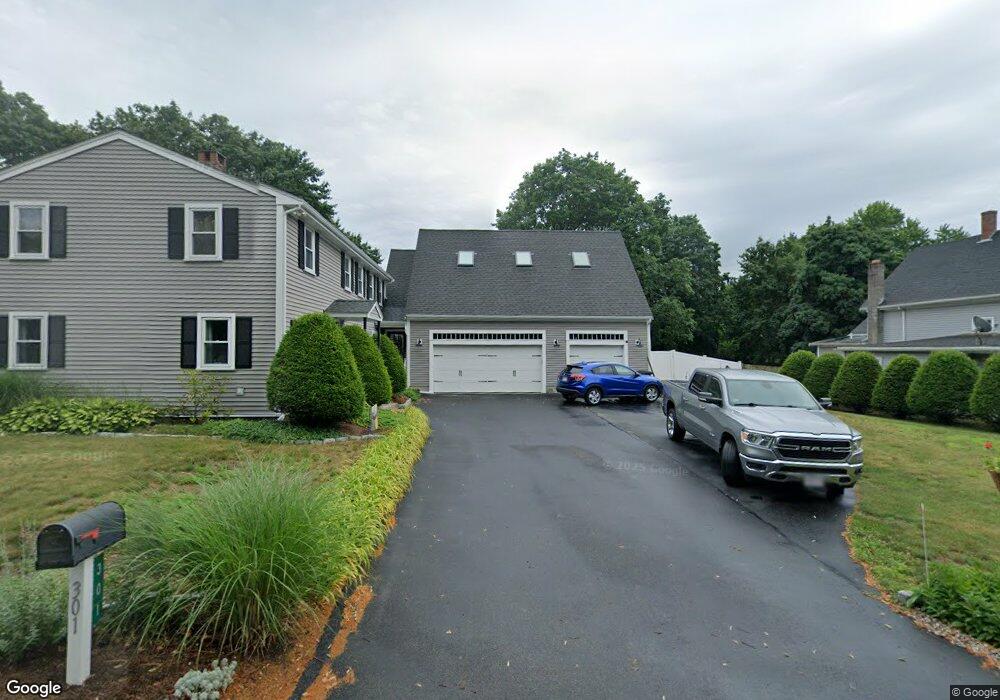
301 Summer St East Bridgewater, MA 02333
Estimated Value: $648,000 - $1,091,000
5
Beds
4
Baths
4,077
Sq Ft
$211/Sq Ft
Est. Value
About This Home
This home is located at 301 Summer St, East Bridgewater, MA 02333 and is currently estimated at $859,078, approximately $210 per square foot. 301 Summer St is a home located in Plymouth County with nearby schools including Central Elementary School, Gordon W Mitchell Middle School, and East Bridgewater Jr./Sr. High School.
Ownership History
Date
Name
Owned For
Owner Type
Purchase Details
Closed on
May 21, 2007
Sold by
Mcalpine Scott W and Decoste Aimee E
Bought by
Mcalpine Scott W and Mcalpine Aimee E
Current Estimated Value
Home Financials for this Owner
Home Financials are based on the most recent Mortgage that was taken out on this home.
Original Mortgage
$298,400
Interest Rate
6.18%
Mortgage Type
Purchase Money Mortgage
Purchase Details
Closed on
Jul 30, 2004
Sold by
Frazier Harold J and Frazier-Koppen Maryann
Bought by
Mcalpine Scott W and Decoste Aimee E
Home Financials for this Owner
Home Financials are based on the most recent Mortgage that was taken out on this home.
Original Mortgage
$273,600
Interest Rate
6.33%
Mortgage Type
Purchase Money Mortgage
Create a Home Valuation Report for This Property
The Home Valuation Report is an in-depth analysis detailing your home's value as well as a comparison with similar homes in the area
Home Values in the Area
Average Home Value in this Area
Purchase History
| Date | Buyer | Sale Price | Title Company |
|---|---|---|---|
| Mcalpine Scott W | -- | -- | |
| Mcalpine Scott W | $342,000 | -- |
Source: Public Records
Mortgage History
| Date | Status | Borrower | Loan Amount |
|---|---|---|---|
| Open | Mcalpine Scott W | $293,800 | |
| Closed | Mcalpine Scott W | $298,400 | |
| Previous Owner | Mcalpine Scott W | $273,600 |
Source: Public Records
Tax History Compared to Growth
Tax History
| Year | Tax Paid | Tax Assessment Tax Assessment Total Assessment is a certain percentage of the fair market value that is determined by local assessors to be the total taxable value of land and additions on the property. | Land | Improvement |
|---|---|---|---|---|
| 2025 | $11,159 | $816,300 | $193,500 | $622,800 |
| 2024 | $10,972 | $792,800 | $186,100 | $606,700 |
| 2023 | $10,348 | $716,100 | $186,100 | $530,000 |
| 2022 | $10,541 | $675,700 | $169,300 | $506,400 |
| 2021 | $4,977 | $608,000 | $162,700 | $445,300 |
| 2020 | $10,331 | $597,500 | $156,400 | $441,100 |
| 2019 | $4,447 | $557,000 | $149,500 | $407,500 |
| 2018 | $4,340 | $541,800 | $149,500 | $392,300 |
| 2017 | $4,003 | $427,800 | $142,600 | $285,200 |
| 2016 | $5,156 | $283,900 | $142,600 | $141,300 |
| 2015 | $5,008 | $282,000 | $141,600 | $140,400 |
| 2014 | $4,813 | $277,100 | $138,600 | $138,500 |
Source: Public Records
Map
Nearby Homes
- 446 Elm St
- 416 Highland St
- 50 Belmont St
- 25 Plain St
- 20 Plain St
- 139 Geralynn Dr
- 51 Darby Rd
- 38 Leland St
- 24 Ithica Rd
- 386 Matfield St
- 505 N Central St
- 11 Willow Ave
- 221 Sinclair Rd
- 585 N Bedford St
- 407 W Union St
- 611 N Bedford St
- 22 Water St
- 21 Friendship Dr
- 848 N Bedford St Phase III
- 11 Harmony Crossing