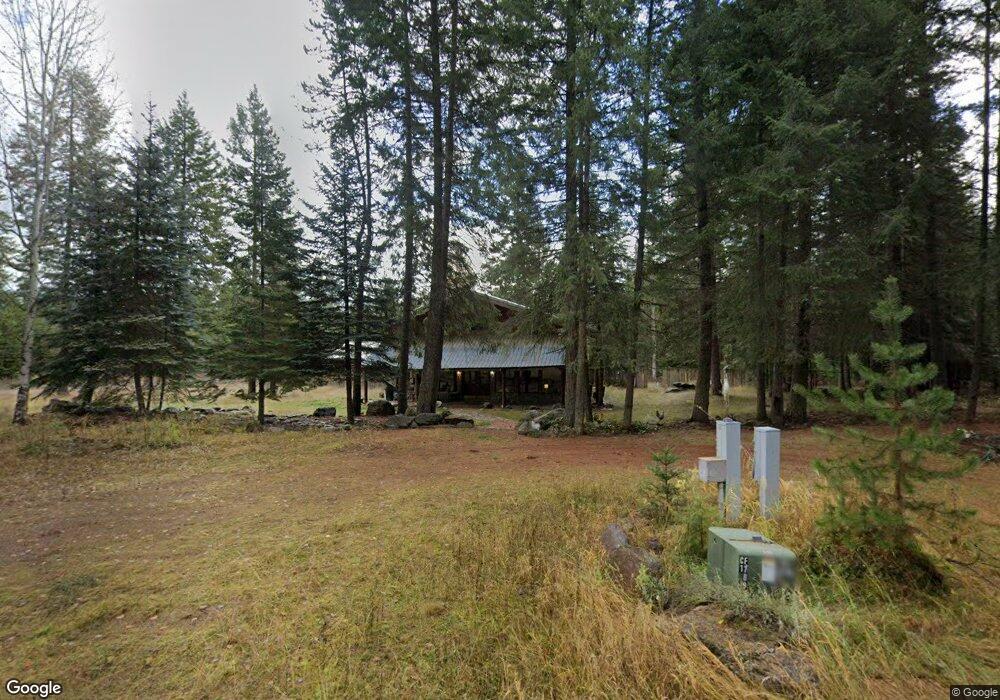
301 Timber Ridge Trail Clark Fork, ID 83811
Estimated Value: $843,121 - $1,306,000
12
Beds
5
Baths
5,680
Sq Ft
$175/Sq Ft
Est. Value
About This Home
This home is located at 301 Timber Ridge Trail, Clark Fork, ID 83811 and is currently estimated at $995,280, approximately $175 per square foot. 301 Timber Ridge Trail is a home located in Bonner County with nearby schools including Hope Elementary School and Clark Fork Junior/Senior High School.
Ownership History
Date
Name
Owned For
Owner Type
Purchase Details
Closed on
Oct 26, 2021
Sold by
Equity Trust Company
Bought by
Camara Lisa
Current Estimated Value
Home Financials for this Owner
Home Financials are based on the most recent Mortgage that was taken out on this home.
Original Mortgage
$526,500
Outstanding Balance
$481,705
Interest Rate
2.88%
Mortgage Type
New Conventional
Estimated Equity
$513,575
Purchase Details
Closed on
Oct 25, 2021
Sold by
Equity Trust Company
Bought by
Equity Trust Company and Valerie Musbach Ira
Home Financials for this Owner
Home Financials are based on the most recent Mortgage that was taken out on this home.
Original Mortgage
$526,500
Outstanding Balance
$481,705
Interest Rate
2.88%
Mortgage Type
New Conventional
Estimated Equity
$513,575
Purchase Details
Closed on
May 15, 2012
Sold by
Bank Of America N A
Bought by
Equity Trut Co
Purchase Details
Closed on
Jun 30, 2011
Sold by
Scott Mark A
Bought by
Bac Home Loans Servicing Lp
Create a Home Valuation Report for This Property
The Home Valuation Report is an in-depth analysis detailing your home's value as well as a comparison with similar homes in the area
Home Values in the Area
Average Home Value in this Area
Purchase History
| Date | Buyer | Sale Price | Title Company |
|---|---|---|---|
| Camara Lisa | -- | North Idaho Title Company | |
| Equity Trust Company | -- | North Idaho Title Company | |
| Equity Trut Co | -- | None Available | |
| Bac Home Loans Servicing Lp | -- | -- |
Source: Public Records
Mortgage History
| Date | Status | Borrower | Loan Amount |
|---|---|---|---|
| Open | Camara Lisa | $526,500 |
Source: Public Records
Tax History
| Year | Tax Paid | Tax Assessment Tax Assessment Total Assessment is a certain percentage of the fair market value that is determined by local assessors to be the total taxable value of land and additions on the property. | Land | Improvement |
|---|---|---|---|---|
| 2025 | $2,210 | $735,503 | $242,438 | $493,065 |
| 2024 | $2,805 | $722,792 | $189,693 | $533,099 |
| 2023 | $2,433 | $810,144 | $206,446 | $603,698 |
| 2022 | $2,770 | $751,909 | $125,409 | $626,500 |
| 2021 | $3,013 | $465,417 | $40,043 | $425,374 |
| 2020 | $2,990 | $429,850 | $36,124 | $393,726 |
| 2019 | $2,886 | $455,975 | $36,012 | $419,963 |
| 2018 | $2,674 | $393,782 | $30,034 | $363,748 |
| 2017 | $2,674 | $348,116 | $0 | $0 |
| 2016 | $2,751 | $348,116 | $0 | $0 |
| 2015 | $2,817 | $357,266 | $0 | $0 |
| 2014 | $2,842 | $357,266 | $0 | $0 |
Source: Public Records
Map
Nearby Homes
- 475 Dry Creek Rd
- NKA Condor Dr
- 189 Blue Creek Rd
- 439 Usfs 2295a
- 58250 Idaho 200
- Usfs Rd 2294
- 0 Nka Unit 24979743
- Tract 7 Usfs 2294
- Tract 6 Usfs 2294
- Tract 5 Usfs 2294
- Tract 4 Usfs 2294
- Tract 3 Usfs 2294
- 241 N River Lake Dr
- 16 Elk Horn
- 103 N Stephen St
- 102 E 2nd Ave
- NNA Hwy 200
- 60317 Idaho 200
- NKA Silver Creek Rd
- nna Lightning Creek Rd
- 301 Timber Ridge Trail
- 301 Timber Ridge Trail
- 405 Timber Ridge Trail
- 405 Timber Ridge Trail
- 76 Footloose Moose Trail
- 0 Cabinet Gorge Rd
- 591 Cabinet Gorge Rd
- 45 acres off Cabinet Gorge Rd
- nna Cabinet Gorge Rd
- NNA Timber Ridge
- 45 acres Cabinet Gorge
- 507 Lowrey Ln
- 507 Lowrey Ln
- 39 Hatchery Rd
- 178 Lowrey Ct
- 49 Hatchery Rd
- 272 Lowrey Ln
- 125 Hatchery Rd
- 194 Lowrey Ct
- 657 Lone Cedar Ln
Your Personal Tour Guide
Ask me questions while you tour the home.