
Landlord's Agent in 2017
Dani Barthel
Cummings & Co Realtors
(443) 910-3736
18 in this area
71 Total Sales
Estimated Value: $254,110 - $280,000
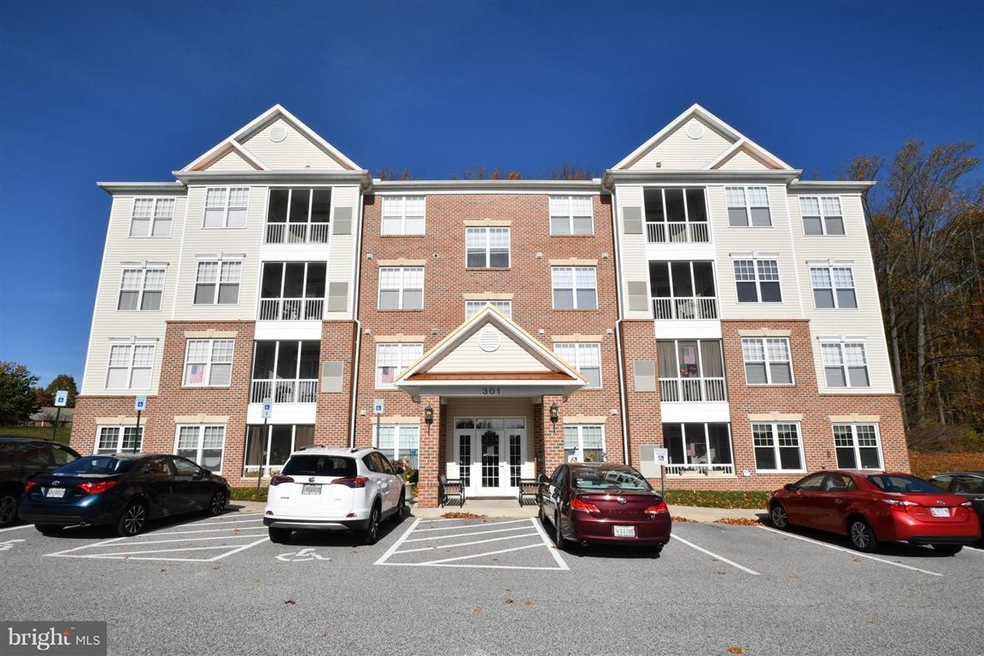
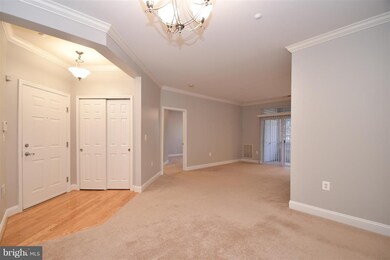
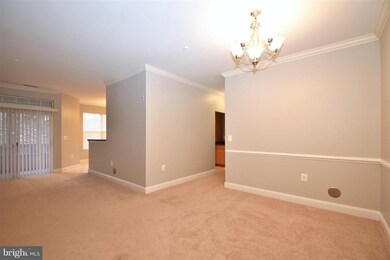
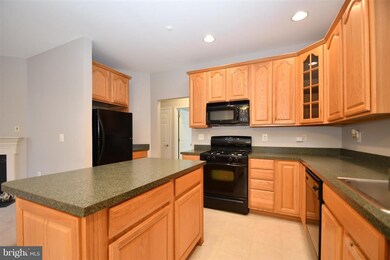
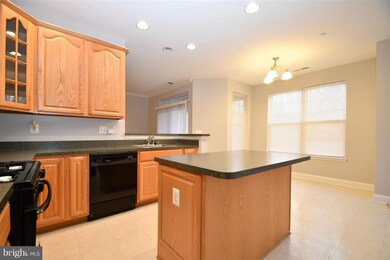
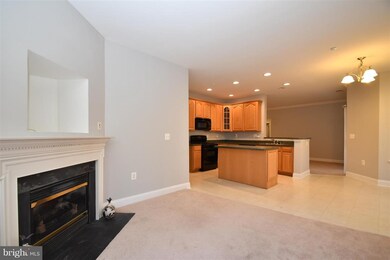
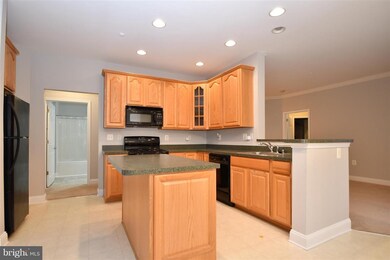
BEAUTIFUL AND PRIVATE 55+ CONDO AVAILABLE IMMEDIATELY. SPACIOUS 2 BDRM, 2 BATH 1ST FLOOR CONDO W/SCREENED IN PORCH BACKING TO TREES. EAT-IN KIT W/ISLAND, COZY FAMILY ROOM OFF THE KITCHEN FEATURING GAS FIREPLACE. LIVING ROOM & SEP DINING AREA. COMMUNITY CENTER W/POOL & FITNESS ROOM INCLUDED IN RENT. CLOSE TO LIBRARY & SHOPPING. PETS CASE BY CASE BASIS W/FEE.
Last Agent to Rent the Property
(410) 823-0033 realtor@cummingsrealtors.com Cummings & Co. Realtors Listed on: 11/13/2017
| Date | Buyer | Sale Price | Title Company |
|---|---|---|---|
| Burke John P | $205,000 | Universal Title | |
| Smolenski James P | $213,550 | -- | |
| Smolenski James P | $213,550 | -- |
| Date | Status | Borrower | Loan Amount |
|---|---|---|---|
| Open | Burke John P | $115,000 | |
| Previous Owner | Smolenski James P | $53,388 | |
| Previous Owner | Smolenski James P | $160,162 | |
| Previous Owner | Smolenski James P | $160,162 |
| Date | Event | Price | List to Sale | Price per Sq Ft |
|---|---|---|---|---|
| 11/29/2017 11/29/17 | Rented | $1,400 | 0.0% | -- |
| 11/29/2017 11/29/17 | Under Contract | -- | -- | -- |
| 11/13/2017 11/13/17 | For Rent | $1,400 | +7.7% | -- |
| 06/15/2017 06/15/17 | Rented | $1,300 | -7.1% | -- |
| 05/16/2017 05/16/17 | Under Contract | -- | -- | -- |
| 02/28/2017 02/28/17 | For Rent | $1,400 | +3.7% | -- |
| 10/01/2014 10/01/14 | Rented | $1,350 | -3.6% | -- |
| 10/01/2014 10/01/14 | Under Contract | -- | -- | -- |
| 08/25/2014 08/25/14 | For Rent | $1,400 | -- | -- |
| Year | Tax Paid | Tax Assessment Tax Assessment Total Assessment is a certain percentage of the fair market value that is determined by local assessors to be the total taxable value of land and additions on the property. | Land | Improvement |
|---|---|---|---|---|
| 2025 | $2,291 | $219,400 | $0 | $0 |
| 2024 | $2,291 | $210,200 | $0 | $0 |
| 2023 | $2,191 | $201,000 | $57,500 | $143,500 |
| 2022 | $2,158 | $198,000 | $0 | $0 |
| 2021 | $4,381 | $195,000 | $0 | $0 |
| 2020 | $2,216 | $192,000 | $57,500 | $134,500 |
| 2019 | $2,135 | $185,000 | $0 | $0 |
| 2018 | $1,975 | $178,000 | $0 | $0 |
| 2017 | $1,956 | $171,000 | $0 | $0 |
| 2016 | -- | $171,000 | $0 | $0 |
| 2015 | $2,396 | $171,000 | $0 | $0 |
| 2014 | $2,396 | $189,500 | $0 | $0 |
Landlord's Agent in 2017
Dani Barthel
Cummings & Co Realtors
(443) 910-3736
18 in this area
71 Total Sales
Seller Co-Listing Agent in 2017
Lana Ophardt
Cummings & Co Realtors
(443) 540-1801
25 in this area
76 Total Sales
Tenant's Agent in 2017
Weddina Miller
Coldwell Banker (NRT-Southeast-MidAtlantic)
(443) 790-1130
1 in this area
2 Total Sales
Buyer's Agent in 2017
Laura Snyder
American Premier Realty, LLC
(410) 375-5779
161 in this area
618 Total Sales
Buyer's Agent in 2014
Yvonne Richards
Long & Foster
(443) 219-6789
1 in this area
4 Total Sales
Source: Bright MLS
MLS Number: 1004129909
APN: 01-373870
Disclaimer: Certain information contained herein is derived from information provided by parties other than Homes.com. All information provided is deemed reliable, but is not guaranteed to be accurate and should be independently verified.
![]() The data relating to real estate for sale on this website appears in part through the BRIGHT Internet Data Exchange program, a voluntary cooperative exchange of property listing data between licensed real estate brokerage firms, and is provided by BRIGHT through a licensing agreement.
The data relating to real estate for sale on this website appears in part through the BRIGHT Internet Data Exchange program, a voluntary cooperative exchange of property listing data between licensed real estate brokerage firms, and is provided by BRIGHT through a licensing agreement.
Listing information is from various brokers who participate in the Bright MLS IDX program and not all listings may be visible on the site.
The property information being provided on or through the website is for the personal, non-commercial use of consumers and such information may not be used for any purpose other than to identify prospective properties consumers may be interested in purchasing.
Some properties which appear for sale on the website may no longer be available because they are for instance, under contract, sold or are no longer being offered for sale.
Property information displayed is deemed reliable but is not guaranteed.
Copyright 2026 Bright MLS, Inc.
Ask me questions while you tour the home.