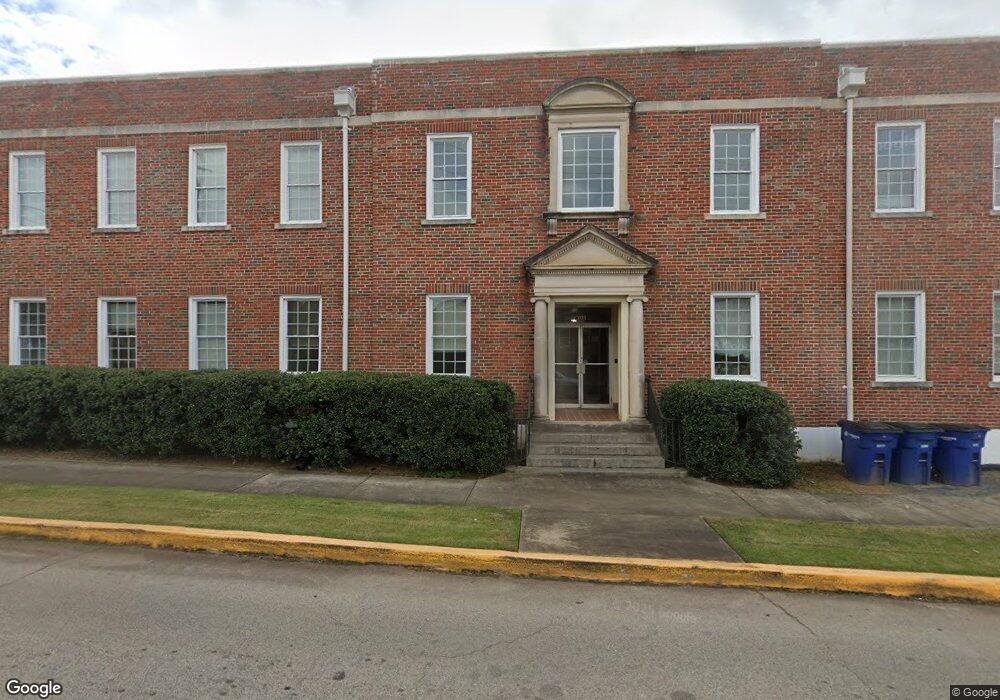
301 W Broome St Unit SUITE111 La Grange, GA 30240
Estimated Value: $486,824
--
Bed
1
Bath
14,369
Sq Ft
$34/Sq Ft
Est. Value
About This Home
This home is located at 301 W Broome St Unit SUITE111, La Grange, GA 30240 and is currently estimated at $486,824, approximately $33 per square foot. 301 W Broome St Unit SUITE111 is a home located in Troup County with nearby schools including Hollis Hand Elementary School, Franklin Forest Elementary School, and Ethel W. Kight Elementary School.
Ownership History
Date
Name
Owned For
Owner Type
Purchase Details
Closed on
Dec 17, 2019
Sold by
Hammett Building Llc
Bought by
Hammett House Llc
Current Estimated Value
Purchase Details
Closed on
Feb 17, 2002
Sold by
Joseph E Daniel
Bought by
Hammett Building Llc
Purchase Details
Closed on
Feb 16, 2002
Sold by
Richlan Properties Llc
Bought by
Joseph E Daniel
Purchase Details
Closed on
Feb 15, 2002
Sold by
Roy Spinks J
Bought by
Richlan Properties Llc
Purchase Details
Closed on
Feb 14, 2002
Sold by
Bhj Associates
Bought by
Roy Spinks J
Purchase Details
Closed on
Jun 1, 2001
Sold by
Joseph J Shambo Jr Etal
Bought by
Bhj Associates
Purchase Details
Closed on
May 13, 1994
Sold by
James F Butts
Bought by
Joseph J Shambo Jr Etal
Purchase Details
Closed on
Jan 5, 1984
Sold by
Daniel A E Et-Al
Bought by
James F Butts
Purchase Details
Closed on
Oct 23, 1980
Sold by
Ross
Bought by
Daniel A E Et-Al
Purchase Details
Closed on
Jan 1, 1975
Sold by
Divorce
Bought by
Ross
Create a Home Valuation Report for This Property
The Home Valuation Report is an in-depth analysis detailing your home's value as well as a comparison with similar homes in the area
Home Values in the Area
Average Home Value in this Area
Purchase History
| Date | Buyer | Sale Price | Title Company |
|---|---|---|---|
| Hammett House Llc | $275,000 | -- | |
| Hammett Building Llc | $84,600 | -- | |
| Joseph E Daniel | -- | -- | |
| Richlan Properties Llc | -- | -- | |
| Roy Spinks J | -- | -- | |
| Bhj Associates | $115,000 | -- | |
| Joseph J Shambo Jr Etal | $43,000 | -- | |
| James F Butts | $270,000 | -- | |
| Daniel A E Et-Al | $167,000 | -- | |
| Ross | -- | -- |
Source: Public Records
Tax History Compared to Growth
Tax History
| Year | Tax Paid | Tax Assessment Tax Assessment Total Assessment is a certain percentage of the fair market value that is determined by local assessors to be the total taxable value of land and additions on the property. | Land | Improvement |
|---|---|---|---|---|
| 2024 | $6,984 | $223,320 | $61,280 | $162,040 |
| 2023 | $5,658 | $180,920 | $61,280 | $119,640 |
| 2022 | $5,957 | $219,640 | $61,280 | $158,360 |
| 2021 | $4,203 | $123,040 | $61,280 | $61,760 |
| 2020 | $4,363 | $127,720 | $61,280 | $66,440 |
| 2019 | $4,782 | $140,000 | $61,280 | $78,720 |
| 2018 | $4,782 | $140,000 | $61,280 | $78,720 |
| 2017 | $4,065 | $140,000 | $61,280 | $78,720 |
| 2016 | $3,522 | $143,761 | $61,288 | $82,473 |
| 2015 | $5,245 | $153,309 | $54,869 | $98,440 |
| 2014 | $5,252 | $153,309 | $54,869 | $98,440 |
| 2013 | -- | $153,309 | $54,869 | $98,440 |
Source: Public Records
Map
Nearby Homes
- 301 W Broome St Unit 206
- 301 W Broome St Unit 205
- 301 W Broome St Unit 209,211,213
- 301 W Broome St
- 301 W Broome St Unit SUITE108
- 301 W Broome St Unit SUITE110
- 301 W Broome St Unit SUITE107/109
- 301 W Broome St Unit 201/202
- 301 W Broome St Unit Suite 208
- 300 W Broome St Unit STE. 200
- 300 W Broome St Unit SUITE 106
- 300 W Broome St Unit SUITE 102
- 300 W Broome St Unit Suite 203 West
- 305 S Greenwood St
- 307 S Greenwood St
- 204 S Lewis St
- 208 W Broome St
- 210 W Broome St
- 401 S Greenwood St
- 307 S Lewis St Unit C