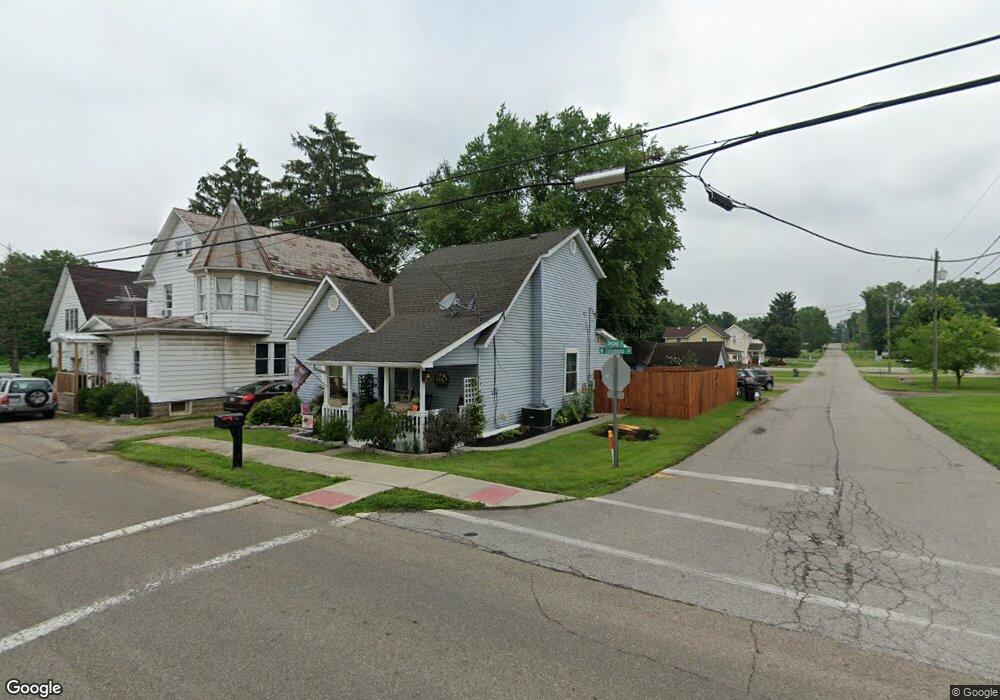
301 W Columbus St Pleasantville, OH 43148
Estimated Value: $151,000 - $220,000
2
Beds
1
Bath
1,347
Sq Ft
$139/Sq Ft
Est. Value
About This Home
This home is located at 301 W Columbus St, Pleasantville, OH 43148 and is currently estimated at $187,185, approximately $138 per square foot. 301 W Columbus St is a home located in Fairfield County with nearby schools including Pleasantville Elementary School and Fairfield Union High School.
Ownership History
Date
Name
Owned For
Owner Type
Purchase Details
Closed on
Jun 24, 2010
Sold by
Wells Fargo Bank National Association
Bought by
Sowards Teresa J
Current Estimated Value
Home Financials for this Owner
Home Financials are based on the most recent Mortgage that was taken out on this home.
Original Mortgage
$54,170
Interest Rate
4.87%
Mortgage Type
FHA
Purchase Details
Closed on
Mar 2, 2010
Sold by
Castle Ben and Castle Ben A
Bought by
Wells Fargo Bank National Association
Purchase Details
Closed on
Sep 20, 1999
Sold by
Daugherty Jodi
Bought by
Castle Benjamin A
Home Financials for this Owner
Home Financials are based on the most recent Mortgage that was taken out on this home.
Original Mortgage
$40,700
Interest Rate
7.93%
Mortgage Type
New Conventional
Purchase Details
Closed on
Jun 1, 1989
Purchase Details
Closed on
May 1, 1988
Create a Home Valuation Report for This Property
The Home Valuation Report is an in-depth analysis detailing your home's value as well as a comparison with similar homes in the area
Home Values in the Area
Average Home Value in this Area
Purchase History
| Date | Buyer | Sale Price | Title Company |
|---|---|---|---|
| Sowards Teresa J | $54,900 | None Available | |
| Wells Fargo Bank National Association | $48,000 | Attorney | |
| Castle Benjamin A | $42,000 | -- | |
| -- | $39,000 | -- | |
| -- | $38,000 | -- |
Source: Public Records
Mortgage History
| Date | Status | Borrower | Loan Amount |
|---|---|---|---|
| Previous Owner | Sowards Teresa J | $54,170 | |
| Previous Owner | Castle Benjamin A | $40,700 |
Source: Public Records
Tax History Compared to Growth
Tax History
| Year | Tax Paid | Tax Assessment Tax Assessment Total Assessment is a certain percentage of the fair market value that is determined by local assessors to be the total taxable value of land and additions on the property. | Land | Improvement |
|---|---|---|---|---|
| 2024 | $2,830 | $36,280 | $4,160 | $32,120 |
| 2023 | $1,465 | $36,280 | $4,160 | $32,120 |
| 2022 | $1,466 | $36,280 | $4,160 | $32,120 |
| 2021 | $1,355 | $30,420 | $4,160 | $26,260 |
| 2020 | $1,358 | $30,420 | $4,160 | $26,260 |
| 2019 | $1,359 | $30,420 | $4,160 | $26,260 |
| 2018 | $1,018 | $23,090 | $4,160 | $18,930 |
| 2017 | $1,019 | $21,650 | $4,170 | $17,480 |
| 2016 | $940 | $21,650 | $4,170 | $17,480 |
| 2015 | $970 | $22,120 | $4,390 | $17,730 |
| 2014 | $929 | $22,120 | $4,390 | $17,730 |
| 2013 | $929 | $22,120 | $4,390 | $17,730 |
Source: Public Records
Map
Nearby Homes
- 301 N Main St
- 113 Pearl St
- 216 1st St
- 304 E Columbus St
- 2865 Leitnaker Rd NE
- 6781 Thoreau Ln NE
- 3520 Baltimore Somerset Rd NE
- 0 Baltimore Somerset Rd NE
- 2500 Main St
- 8105 Long St
- 2161 E Main St
- 8095 High St
- 8101 High St
- 8061 Maple St
- 5505 Tschopp Rd NE
- 0 Lancaster-Newark Rd NE
- 2991 Coonpath Rd NE
- 0 Marquette Dr NE Unit Lot 16 225027323
- 0 Marquette Dr NE Unit Lot 4 225007276
- 2975 Pleasant Dr NE