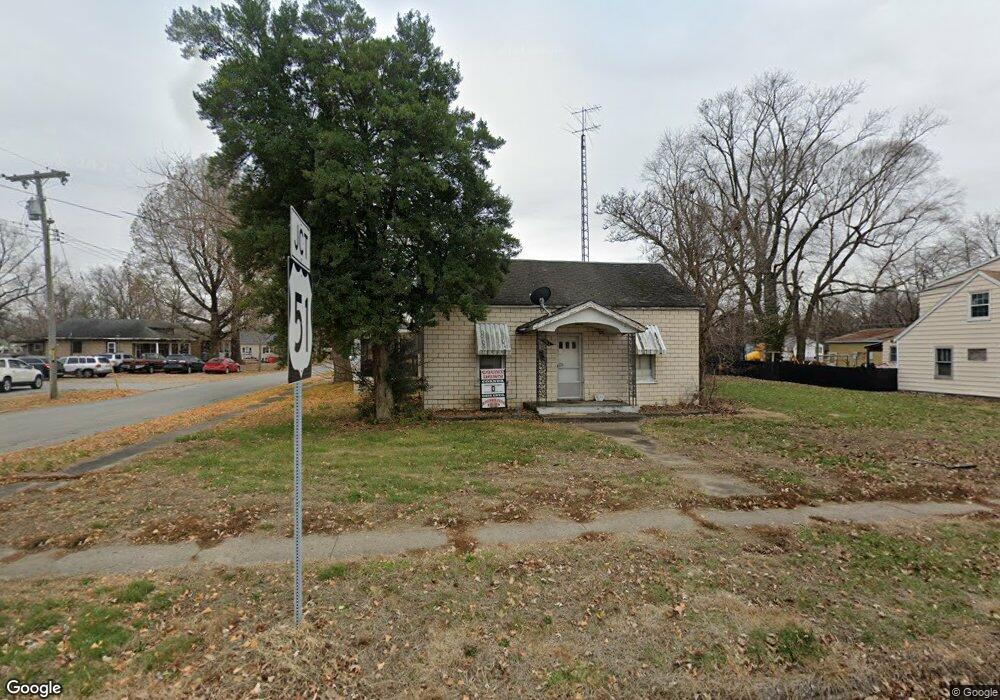
301 W Main St Du Quoin, IL 62832
Estimated Value: $42,580 - $60,000
--
Bed
--
Bath
--
Sq Ft
7,841
Sq Ft Lot
About This Home
This home is located at 301 W Main St, Du Quoin, IL 62832 and is currently estimated at $52,645. 301 W Main St is a home located in Perry County with nearby schools including DuQuoin High School, DuQuoin Elementary School, and DuQuoin Middle School.
Ownership History
Date
Name
Owned For
Owner Type
Purchase Details
Closed on
Jul 11, 2016
Sold by
Higgerson William Matthew
Bought by
Daniels Ii Doug A
Current Estimated Value
Home Financials for this Owner
Home Financials are based on the most recent Mortgage that was taken out on this home.
Original Mortgage
$22,500
Outstanding Balance
$19,277
Interest Rate
6.11%
Mortgage Type
New Conventional
Estimated Equity
$33,368
Purchase Details
Closed on
Jun 27, 2014
Sold by
Higgerson Amber Dawn and Dintelman Amber Dawn
Bought by
Higgerson William Matthew
Create a Home Valuation Report for This Property
The Home Valuation Report is an in-depth analysis detailing your home's value as well as a comparison with similar homes in the area
Home Values in the Area
Average Home Value in this Area
Purchase History
| Date | Buyer | Sale Price | Title Company |
|---|---|---|---|
| Daniels Ii Doug A | $25,000 | Attorney | |
| Higgerson William Matthew | -- | None Available |
Source: Public Records
Mortgage History
| Date | Status | Borrower | Loan Amount |
|---|---|---|---|
| Open | Daniels Ii Doug A | $22,500 |
Source: Public Records
Tax History Compared to Growth
Tax History
| Year | Tax Paid | Tax Assessment Tax Assessment Total Assessment is a certain percentage of the fair market value that is determined by local assessors to be the total taxable value of land and additions on the property. | Land | Improvement |
|---|---|---|---|---|
| 2023 | $427 | $11,281 | $2,315 | $8,966 |
| 2022 | $395 | $10,289 | $2,111 | $8,178 |
| 2021 | $359 | $9,650 | $1,980 | $7,670 |
| 2020 | $300 | $8,929 | $1,832 | $7,097 |
| 2019 | $274 | $8,669 | $1,779 | $6,890 |
| 2018 | $259 | $8,669 | $1,779 | $6,890 |
| 2017 | $264 | $8,700 | $1,785 | $6,915 |
| 2016 | $248 | $8,508 | $1,746 | $6,762 |
| 2015 | $248 | $8,508 | $1,746 | $6,762 |
| 2013 | $235 | $8,348 | $1,713 | $6,635 |
Source: Public Records
Map
Nearby Homes
- 419 W Main St
- 115 S Hickory St
- 209 W Franklin St
- 507 W Main St
- 13 N Division St
- 6 S Division St
- 107 N Division St
- 209 S Walnut St
- 12 N Division St
- 311 E South St
- 501 S Washington St
- 213 S Peach St
- 402 E Keyes St
- 418 E Keyes St
- 535 E Main St
- 540 E Main St
- 544 E Main St
- 734 N Division St
- 9 S Illinois Ave
- 706 E Terrace Dr