Estimated Value: $207,398 - $270,000
4
Beds
2
Baths
2,600
Sq Ft
$88/Sq Ft
Est. Value
About This Home
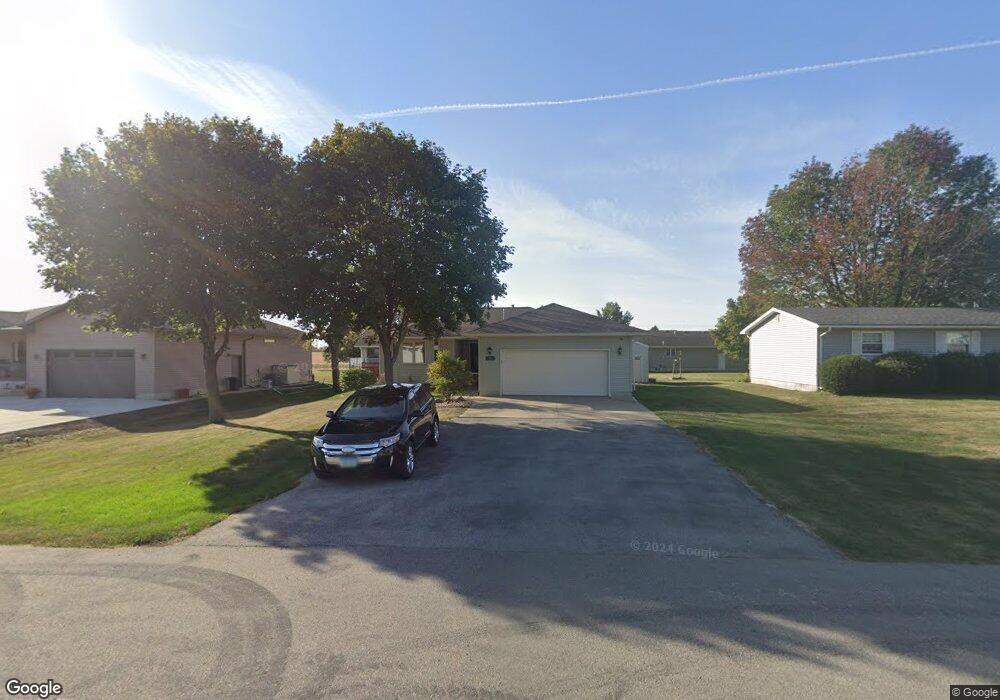
This home is located at 301 W Spring St, Manly, IA 50456 and is currently estimated at $229,350, approximately $88 per square foot. 301 W Spring St is a home located in Worth County with nearby schools including Central Springs High School.
Ownership History
Date
Name
Owned For
Owner Type
Purchase Details
Closed on
Aug 18, 2016
Sold by
Shook Gaylon C and Shook Chelsea A
Bought by
Bird Richard J and Bird Tamara S
Current Estimated Value
Purchase Details
Closed on
May 30, 2011
Sold by
Kalvig Robert D and Kalvig Joleen C
Bought by
Shook Gaylon C and Shook Chelsea A
Home Financials for this Owner
Home Financials are based on the most recent Mortgage that was taken out on this home.
Original Mortgage
$149,625
Interest Rate
4.81%
Mortgage Type
New Conventional
Create a Home Valuation Report for This Property
The Home Valuation Report is an in-depth analysis detailing your home's value as well as a comparison with similar homes in the area
Purchase History
| Date | Buyer | Sale Price | Title Company |
|---|---|---|---|
| Bird Richard J | $157,500 | None Available | |
| Shook Gaylon C | $157,500 | None Available |
Source: Public Records
Mortgage History
| Date | Status | Borrower | Loan Amount |
|---|---|---|---|
| Previous Owner | Shook Gaylon C | $149,625 |
Source: Public Records
Tax History
| Year | Tax Paid | Tax Assessment Tax Assessment Total Assessment is a certain percentage of the fair market value that is determined by local assessors to be the total taxable value of land and additions on the property. | Land | Improvement |
|---|---|---|---|---|
| 2025 | $2,954 | $205,942 | $17,820 | $188,122 |
| 2024 | $2,954 | $192,820 | $17,820 | $175,000 |
| 2023 | $2,822 | $192,820 | $17,820 | $175,000 |
| 2022 | $2,684 | $163,854 | $23,760 | $140,094 |
| 2021 | $2,578 | $163,854 | $23,760 | $140,094 |
| 2020 | $2,578 | $153,451 | $15,840 | $137,611 |
| 2019 | $2,464 | $151,468 | $15,840 | $135,628 |
| 2018 | $2,322 | $139,395 | $15,840 | $123,555 |
| 2017 | $2,092 | $139,395 | $15,840 | $123,555 |
| 2016 | $2,022 | $117,945 | $0 | $0 |
| 2015 | $2,022 | $120,296 | $0 | $0 |
| 2014 | $2,036 | $120,296 | $0 | $0 |
Source: Public Records
Map
Nearby Homes
- 217 W Elmore St
- 4 W South St
- 313 W Bosworth St
- 204 E Walnut St
- 215 Church St
- 318 E Walnut St
- 4011 Orchid Ave
- 3495 Thrush Ave
- 504 5th St
- 906 Broad St
- 516-518 Main St
- 21748 A Owl Ave
- 504 South St
- 21530 Pheasant Ave
- 309 3rd St
- 102 Market St
- 120 16th St NE
- 1523 N Quincy Ave
- 19970 290th St
- 811 16th St NE
Your Personal Tour Guide
Ask me questions while you tour the home.