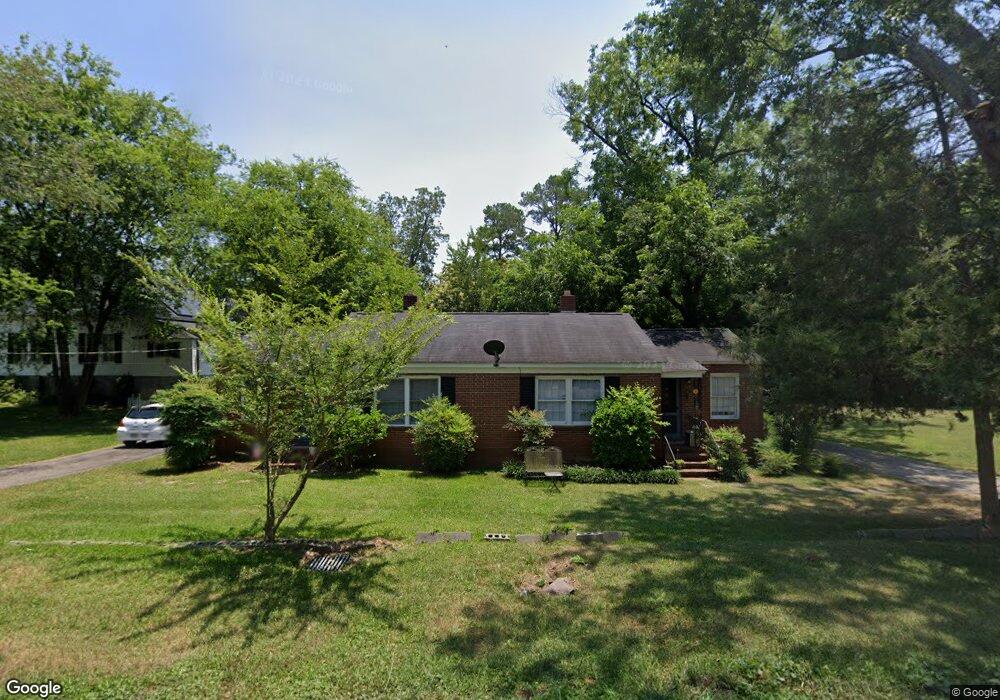
301 W Walnut St Eatonton, GA 31024
Estimated Value: $161,000 - $279,000
--
Bed
2
Baths
1,525
Sq Ft
$129/Sq Ft
Est. Value
About This Home
This home is located at 301 W Walnut St, Eatonton, GA 31024 and is currently estimated at $196,590, approximately $128 per square foot. 301 W Walnut St is a home located in Putnam County with nearby schools including Putnam County Primary School, Putnam County Elementary School, and Putnam County Middle School.
Ownership History
Date
Name
Owned For
Owner Type
Purchase Details
Closed on
Dec 28, 2018
Sold by
Dl Homes Llc
Bought by
Jek Investments Llc
Current Estimated Value
Home Financials for this Owner
Home Financials are based on the most recent Mortgage that was taken out on this home.
Original Mortgage
$76,759
Outstanding Balance
$57,177
Interest Rate
4.8%
Mortgage Type
Commercial
Estimated Equity
$139,413
Purchase Details
Closed on
Jul 27, 2018
Sold by
Maddox Fam Partnership Lllp
Bought by
Dl Homes Llc
Home Financials for this Owner
Home Financials are based on the most recent Mortgage that was taken out on this home.
Original Mortgage
$57,386
Interest Rate
4.5%
Mortgage Type
Commercial
Purchase Details
Closed on
Oct 5, 2001
Sold by
Maddox Jeff A
Bought by
The Maddox Family
Purchase Details
Closed on
Aug 16, 2001
Sold by
Maddox Jeff A
Bought by
Maddox Jeff A
Purchase Details
Closed on
Jan 20, 1980
Bought by
Maddox Jeff A
Create a Home Valuation Report for This Property
The Home Valuation Report is an in-depth analysis detailing your home's value as well as a comparison with similar homes in the area
Home Values in the Area
Average Home Value in this Area
Purchase History
| Date | Buyer | Sale Price | Title Company |
|---|---|---|---|
| Jek Investments Llc | $90,000 | -- | |
| Dl Homes Llc | $56,336 | -- | |
| The Maddox Family | $72,000 | -- | |
| Maddox Jeff A | -- | -- | |
| Maddox Jeff A | $11,600 | -- |
Source: Public Records
Mortgage History
| Date | Status | Borrower | Loan Amount |
|---|---|---|---|
| Open | Jek Investments Llc | $76,759 | |
| Previous Owner | Dl Homes Llc | $57,386 |
Source: Public Records
Tax History Compared to Growth
Tax History
| Year | Tax Paid | Tax Assessment Tax Assessment Total Assessment is a certain percentage of the fair market value that is determined by local assessors to be the total taxable value of land and additions on the property. | Land | Improvement |
|---|---|---|---|---|
| 2024 | $1,422 | $53,283 | $8,000 | $45,283 |
| 2023 | $1,422 | $56,977 | $10,800 | $46,177 |
| 2022 | $1,779 | $56,973 | $8,000 | $48,973 |
| 2021 | $1,280 | $39,479 | $4,752 | $34,727 |
| 2020 | $1,299 | $38,399 | $4,752 | $33,647 |
| 2019 | $1,232 | $22,534 | $4,752 | $17,782 |
| 2018 | $780 | $22,534 | $4,752 | $17,782 |
| 2017 | $735 | $22,534 | $4,752 | $17,782 |
| 2016 | $735 | $22,534 | $4,752 | $17,782 |
| 2015 | $673 | $22,534 | $4,752 | $17,782 |
| 2014 | $672 | $22,534 | $4,752 | $17,782 |
Source: Public Records
Map
Nearby Homes
- 205 W Sumter St
- 157 Overlook Dr
- 139 Overlook Dr
- 100 Overlook Dr
- 156 Anchor Pointe
- 116 SE Hazelwood Dr
- 338 Anchor Pointe
- 113 N Jefferson Ave
- 307 Wayne St
- 204 N Madison Ave
- 106 Putnam Ave
- 110 Beech Ave
- 300 E Magnolia St
- 409 N Jefferson Ave
- 105 Pinecrest Dr
- 103 Spruce Ln
- 104 Blackberry Ln
- 300 Carriage Way
- 302 S Washington Ave
- 206 S Washington Ave
- 303 W Walnut St
- W W Walnut St
- 340 W Walnut St
- 346 W Walnut St
- 302 W Walnut St
- 304 S Washington Ave
- 204 W Walnut St
- 202 S Washington Ave
- 203 W Walnut St
- 305 W Walnut St
- 303 S Washington Ave
- 202 W Walnut St
- 203 S Washington Ave
- S S Washington Ave
- 200 S Washington Ave
- 200 S Washington Ave
- 305 S Washington Ave
- 201 W Walnut St