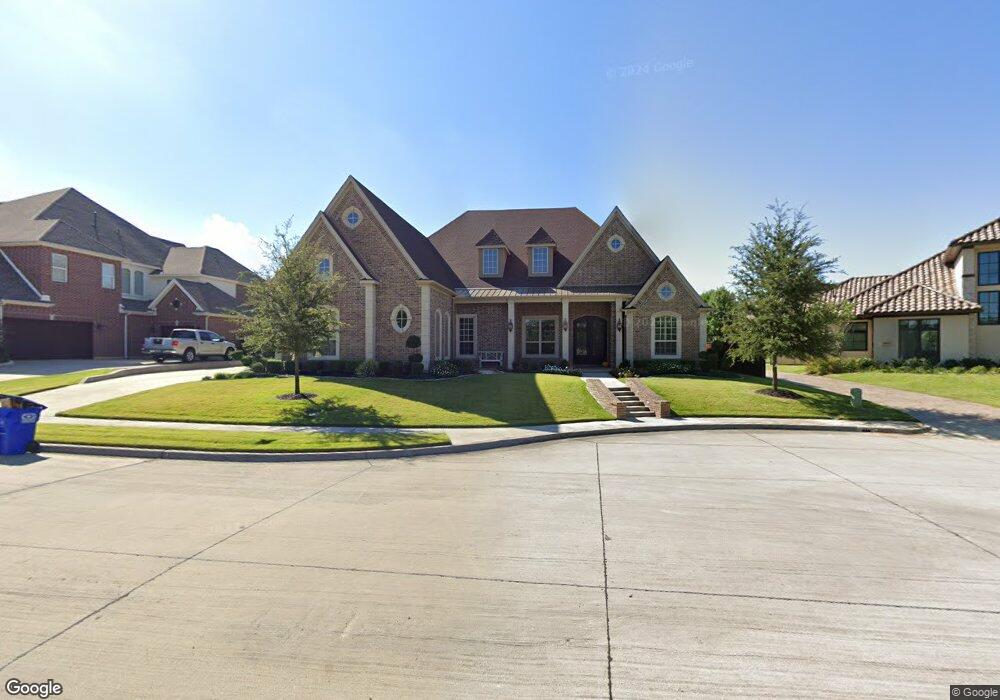
301 Waterfall Ct Colleyville, TX 76034
Estimated Value: $1,205,000 - $1,381,000
4
Beds
3
Baths
3,971
Sq Ft
$319/Sq Ft
Est. Value
About This Home
This home is located at 301 Waterfall Ct, Colleyville, TX 76034 and is currently estimated at $1,267,686, approximately $319 per square foot. 301 Waterfall Ct is a home with nearby schools including Liberty Elementary School, Bear Creek Intermediate School, and Keller Middle School.
Ownership History
Date
Name
Owned For
Owner Type
Purchase Details
Closed on
Nov 20, 2013
Sold by
Dk Triple J Enterprises Llc
Bought by
Chandler Edwin Keith and Chandler Linda Lee
Current Estimated Value
Home Financials for this Owner
Home Financials are based on the most recent Mortgage that was taken out on this home.
Original Mortgage
$650,000
Outstanding Balance
$485,889
Interest Rate
4.29%
Mortgage Type
Purchase Money Mortgage
Estimated Equity
$781,797
Purchase Details
Closed on
Jan 2, 2012
Sold by
Vest Randy J and Vest Kristine V
Bought by
Dk Triple J Enterprises Llc
Purchase Details
Closed on
Oct 18, 2010
Sold by
Sister Initiative Llc
Bought by
Vest Randy
Purchase Details
Closed on
May 27, 2010
Sold by
Bagwell Susan Shamburger
Bought by
Sister Initiative Llc
Purchase Details
Closed on
Jan 26, 2009
Sold by
Old Grove Limited Partnership
Bought by
Bagwell Susan Shamburger
Create a Home Valuation Report for This Property
The Home Valuation Report is an in-depth analysis detailing your home's value as well as a comparison with similar homes in the area
Home Values in the Area
Average Home Value in this Area
Purchase History
| Date | Buyer | Sale Price | Title Company |
|---|---|---|---|
| Chandler Edwin Keith | -- | None Available | |
| Dk Triple J Enterprises Llc | -- | None Available | |
| Vest Randy | -- | None Available | |
| Sister Initiative Llc | -- | None Available | |
| Bagwell Susan Shamburger | -- | None Available |
Source: Public Records
Mortgage History
| Date | Status | Borrower | Loan Amount |
|---|---|---|---|
| Open | Chandler Edwin Keith | $650,000 |
Source: Public Records
Tax History Compared to Growth
Tax History
| Year | Tax Paid | Tax Assessment Tax Assessment Total Assessment is a certain percentage of the fair market value that is determined by local assessors to be the total taxable value of land and additions on the property. | Land | Improvement |
|---|---|---|---|---|
| 2025 | $12,898 | $1,148,383 | $181,400 | $966,983 |
| 2024 | $12,898 | $1,148,383 | $181,400 | $966,983 |
| 2023 | $16,272 | $1,141,521 | $181,400 | $960,121 |
| 2022 | $16,932 | $900,608 | $181,400 | $719,208 |
| 2021 | $16,632 | $727,046 | $165,000 | $562,046 |
| 2020 | $16,924 | $734,630 | $165,000 | $569,630 |
| 2019 | $17,850 | $736,009 | $165,000 | $571,009 |
| 2018 | $14,640 | $713,582 | $165,000 | $548,582 |
| 2017 | $17,719 | $727,383 | $100,000 | $627,383 |
| 2016 | $16,108 | $648,022 | $100,000 | $548,022 |
| 2015 | $2,537 | $757,393 | $100,000 | $657,393 |
| 2014 | $2,537 | $100,000 | $100,000 | $0 |
Source: Public Records
Map
Nearby Homes
- 204 Old Grove Rd
- 7115 Cast Iron Forest Trail
- 7212 John Mccain Rd
- 7400 John Mccain Rd
- 510 Bandit Trail
- 512 Bandit Trail
- 6912 Handel
- 6776 St Moritz Pkwy
- 6108 Westcoat Dr
- 7511 Mount Vernon Dr
- 6809 Strauss
- 7607 Monticello Pkwy
- 203 Polo Trail
- 7702 Tillman Hill Rd
- 6401 Westcoat Dr
- 912 Chateau Ct
- 7033 Benjamin
- 1010 W Mcdonwell School Rd
- 6900 Sir Spencer Ct
- 803 Marie Dr
- 305 Waterfall Ct
- 217 Waterfall Ct
- 300 Hawks Ridge Trail
- 220 Hawks Ridge Trail
- 213 Waterfall Ct
- 304 Hawks Ridge Trail
- 212 Waterfall Ct
- 216 Hawks Ridge Trail
- 209 Waterfall Ct
- 212 Hawks Ridge Trail
- 208 Waterfall Ct
- 208 Hawks Ridge Trail
- 117 Stillwater Cir
- 204 Waterfall Ct
- 221 Hawks Ridge Trail
- 205 Waterfall Ct
- 301 Hawks Ridge Trail
- 217 Hawks Ridge Trail
- 401 Riverpath
- 305 Hawks Ridge Trail