Estimated Value: $287,130 - $352,000
2
Beds
2
Baths
1,146
Sq Ft
$276/Sq Ft
Est. Value
About This Home
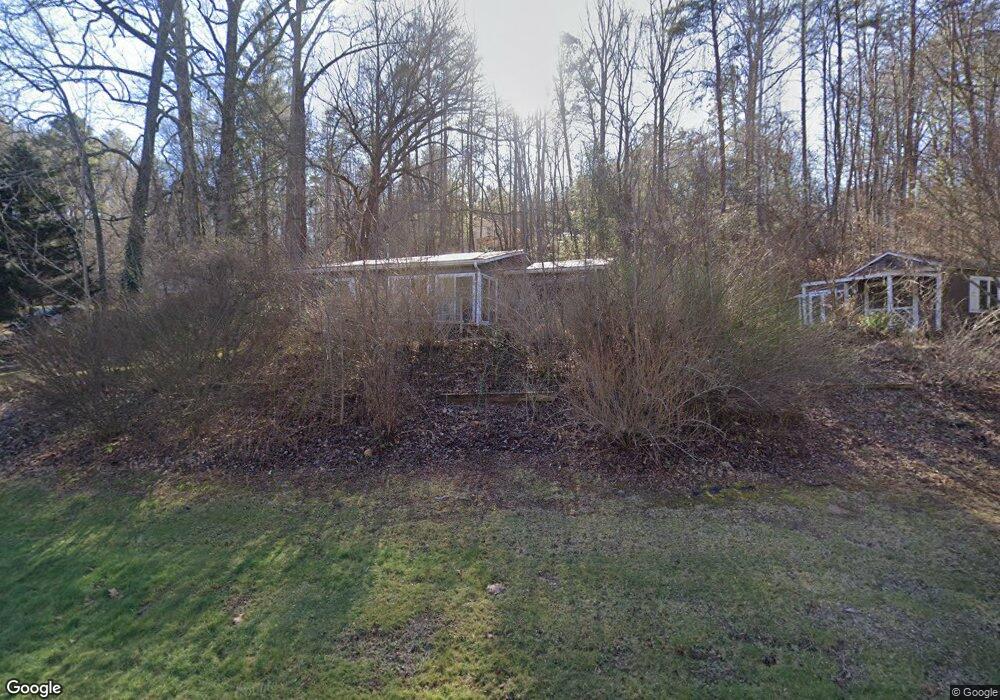
This home is located at 301 Woodall Rd, Tiger, GA 30576 and is currently estimated at $316,783, approximately $276 per square foot. 301 Woodall Rd is a home located in Rabun County with nearby schools including Rabun County Primary School, Rabun County High School, and Great Oaks Montessori .
Ownership History
Date
Name
Owned For
Owner Type
Purchase Details
Closed on
Jun 2, 2021
Sold by
Moore Scott
Bought by
Hutcheson Joseph D and Hutcheson Sarah H
Current Estimated Value
Home Financials for this Owner
Home Financials are based on the most recent Mortgage that was taken out on this home.
Original Mortgage
$191,250
Outstanding Balance
$172,018
Interest Rate
2.9%
Mortgage Type
New Conventional
Estimated Equity
$144,765
Purchase Details
Closed on
Nov 9, 2017
Sold by
Johnson William A
Bought by
Moore Scott and Moore Jennifer S
Purchase Details
Closed on
May 1, 2006
Sold by
Not Provided
Bought by
Johnson William A and Johnson Lee B
Purchase Details
Closed on
Jul 1, 1994
Create a Home Valuation Report for This Property
The Home Valuation Report is an in-depth analysis detailing your home's value as well as a comparison with similar homes in the area
Home Values in the Area
Average Home Value in this Area
Purchase History
| Date | Buyer | Sale Price | Title Company |
|---|---|---|---|
| Hutcheson Joseph D | $225,000 | -- | |
| Hutcheson Joseph D | $225,000 | -- | |
| Hutcheson Joseph D | $225,000 | -- | |
| Hutcheson Joseph D | $225,000 | -- | |
| Moore Scott | $140,500 | -- | |
| Moore Scott | $140,500 | -- | |
| Moore Scott | $140,500 | -- | |
| Moore Scott | $140,500 | -- | |
| Johnson William A | $129,000 | -- | |
| Johnson William A | $129,000 | -- | |
| Johnson William A | $129,000 | -- | |
| Johnson William A | $129,000 | -- | |
| -- | $20,000 | -- | |
| -- | $20,000 | -- | |
| -- | $20,000 | -- | |
| -- | $20,000 | -- |
Source: Public Records
Mortgage History
| Date | Status | Borrower | Loan Amount |
|---|---|---|---|
| Open | Hutcheson Joseph D | $191,250 | |
| Closed | Hutcheson Joseph D | $191,250 |
Source: Public Records
Tax History Compared to Growth
Tax History
| Year | Tax Paid | Tax Assessment Tax Assessment Total Assessment is a certain percentage of the fair market value that is determined by local assessors to be the total taxable value of land and additions on the property. | Land | Improvement |
|---|---|---|---|---|
| 2025 | $1,322 | $82,373 | $10,073 | $72,300 |
| 2024 | $1,250 | $77,886 | $10,073 | $67,813 |
| 2023 | $1,304 | $71,267 | $9,480 | $61,787 |
| 2022 | $1,254 | $68,492 | $8,888 | $59,604 |
| 2021 | $805 | $42,940 | $8,295 | $34,645 |
| 2020 | $752 | $38,791 | $8,295 | $30,496 |
| 2019 | $741 | $38,791 | $8,295 | $30,496 |
| 2018 | $743 | $37,911 | $8,295 | $29,616 |
| 2017 | $443 | $37,173 | $7,742 | $29,431 |
| 2016 | $453 | $37,173 | $7,742 | $29,431 |
| 2015 | $620 | $34,194 | $7,742 | $26,452 |
| 2014 | $623 | $34,196 | $7,744 | $26,452 |
Source: Public Records
Map
Nearby Homes
- 488 Northridge
- 0 Woodall Rd Unit 10618919
- 38 Old Blue Trail
- 556 Summer Rd
- 144 David Dr
- 146 David Dr
- 9 Golf Dr
- 0 Jericho Ln Unit 10624133
- 407 Hillside Dr
- 5 W Pinecrest Dr
- 112 Clayton Dr
- 0 River Birch Ln Unit LOT 32 10554197
- 3.15 ACRES Barnyard Ln
- 63 Redwood Ln
- 276 Dunlap St
- 893 Old 441 S
- 335 S Main St
- 7 Dry Pond Dr
- 211 Blair St
- 167 Travelers Ln
- 301 Woodall Rd Unit 2
- 301 Woodall Rd
- 92 Northridge Dr
- 19 Eastwood Trail
- 271 Woodall Rd
- 63 Eastwood Trail
- 308 Woodall Rd
- 28 Eastwood Trail Unit 2A
- 28 Eastwood Trail
- 86 Eastwood Trail
- 426 Woodall Rd
- 426 Woodall Rd
- 570 Standing Rock Unit 9
- 570 Standing Rock
- 488 Northridge Unit 17
- 28 Northridge Dr
- 204 Woodall Rd
- 0 Rooster Ridge Unit LOT 68 2722484
- 0 Rooster Ridge Unit LOT 67 2722415
- 0 Rooster Ridge Unit LOT 66 2722412