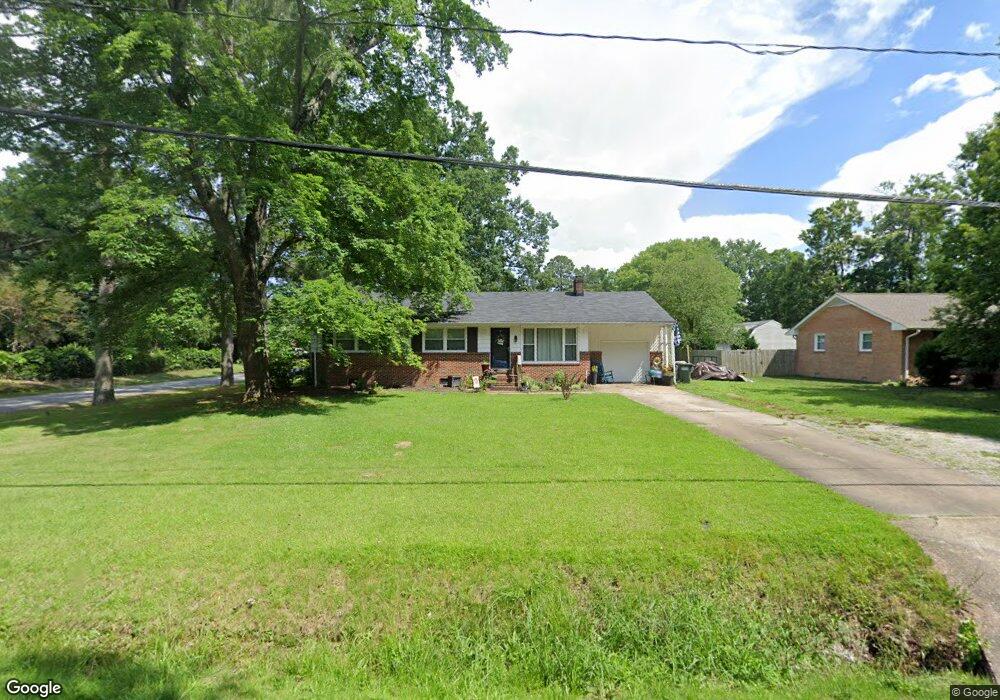
301 York Warwick Dr Yorktown, VA 23692
Estimated Value: $325,233 - $355,000
3
Beds
1
Bath
1,240
Sq Ft
$274/Sq Ft
Est. Value
About This Home
This home is located at 301 York Warwick Dr, Yorktown, VA 23692 and is currently estimated at $340,308, approximately $274 per square foot. 301 York Warwick Dr is a home located in York County with nearby schools including Yorktown Elementary School, Yorktown Middle School, and York High School.
Ownership History
Date
Name
Owned For
Owner Type
Purchase Details
Closed on
Apr 24, 2017
Sold by
Hayes Jason L and Hayes Michelle M
Bought by
Derosier Christopher T and Derosier Amber S
Current Estimated Value
Home Financials for this Owner
Home Financials are based on the most recent Mortgage that was taken out on this home.
Original Mortgage
$238,383
Outstanding Balance
$197,661
Interest Rate
4.08%
Mortgage Type
FHA
Estimated Equity
$142,647
Purchase Details
Closed on
Apr 26, 2006
Sold by
Moore Danny R
Bought by
Hayes Jason L
Home Financials for this Owner
Home Financials are based on the most recent Mortgage that was taken out on this home.
Original Mortgage
$224,730
Interest Rate
6.4%
Mortgage Type
New Conventional
Purchase Details
Closed on
Nov 3, 2003
Sold by
Moore Janet
Bought by
Moore Danny
Home Financials for this Owner
Home Financials are based on the most recent Mortgage that was taken out on this home.
Original Mortgage
$118,000
Interest Rate
6.05%
Mortgage Type
VA
Create a Home Valuation Report for This Property
The Home Valuation Report is an in-depth analysis detailing your home's value as well as a comparison with similar homes in the area
Home Values in the Area
Average Home Value in this Area
Purchase History
| Date | Buyer | Sale Price | Title Company |
|---|---|---|---|
| Derosier Christopher T | $236,000 | Stewart Title & Settlement | |
| Hayes Jason L | $220,000 | -- | |
| Moore Danny | $118,000 | -- |
Source: Public Records
Mortgage History
| Date | Status | Borrower | Loan Amount |
|---|---|---|---|
| Open | Derosier Christopher T | $238,383 | |
| Previous Owner | Hayes Jason L | $224,730 | |
| Previous Owner | Moore Danny | $118,000 |
Source: Public Records
Tax History Compared to Growth
Tax History
| Year | Tax Paid | Tax Assessment Tax Assessment Total Assessment is a certain percentage of the fair market value that is determined by local assessors to be the total taxable value of land and additions on the property. | Land | Improvement |
|---|---|---|---|---|
| 2025 | $1,977 | $267,200 | $116,800 | $150,400 |
| 2024 | $1,977 | $267,200 | $116,800 | $150,400 |
| 2023 | $1,765 | $229,200 | $116,800 | $112,400 |
| 2022 | $1,788 | $229,200 | $116,800 | $112,400 |
| 2021 | $1,722 | $216,600 | $115,000 | $101,600 |
| 2020 | $1,722 | $216,600 | $115,000 | $101,600 |
| 2019 | $2,381 | $208,900 | $115,000 | $93,900 |
| 2018 | $2,381 | $208,900 | $115,000 | $93,900 |
| 2017 | $1,565 | $208,200 | $115,000 | $93,200 |
| 2016 | $1,565 | $208,200 | $115,000 | $93,200 |
| 2015 | -- | $208,200 | $115,000 | $93,200 |
| 2014 | -- | $208,200 | $115,000 | $93,200 |
Source: Public Records
Map
Nearby Homes
- 104 Harris Grove Ln
- 107 Brokenbridge Rd
- 111 Ellery St
- 508 Fleming Way
- 501 Fleming Way
- 115 Peyton Randolph Dr
- 112 Peyton Randolph Dr
- 212 Manchester Way
- 106 Cypress Crossing
- 108 Farmstead Place
- 105 Farmstead Place
- 201 Allen Harris Dr
- 110 Briarwood Place
- 136 Briarwood Place
- 128 Ellis Dr
- 107 Jennie Dr
- The Poplar II Plan at Yorktown Crescent
- 7 Bracewell Ln
- 6 Bracewell Ln
- 4 Bracewell Ln
- 303 York Warwick Dr
- 207 York Warwick Dr
- 309 Cockletown Rd
- 305 York Warwick Dr
- 306 Cockletown Rd
- 205 York Warwick Dr
- 307 Cockletown Rd
- 202 Grafton District Rd
- 307 York Warwick Dr
- 300 York Warwick Dr
- 304 Cockletown Rd
- 206 York Warwick Dr
- 200 Grafton District Rd
- 305 Cockletown Rd
- 203 York Warwick Dr
- 204 York Warwick Dr
- 302 Cockletown Rd
- 300 Grafton District Rd
- 108 Grafton District Rd
- 107 Harris Grove Ln