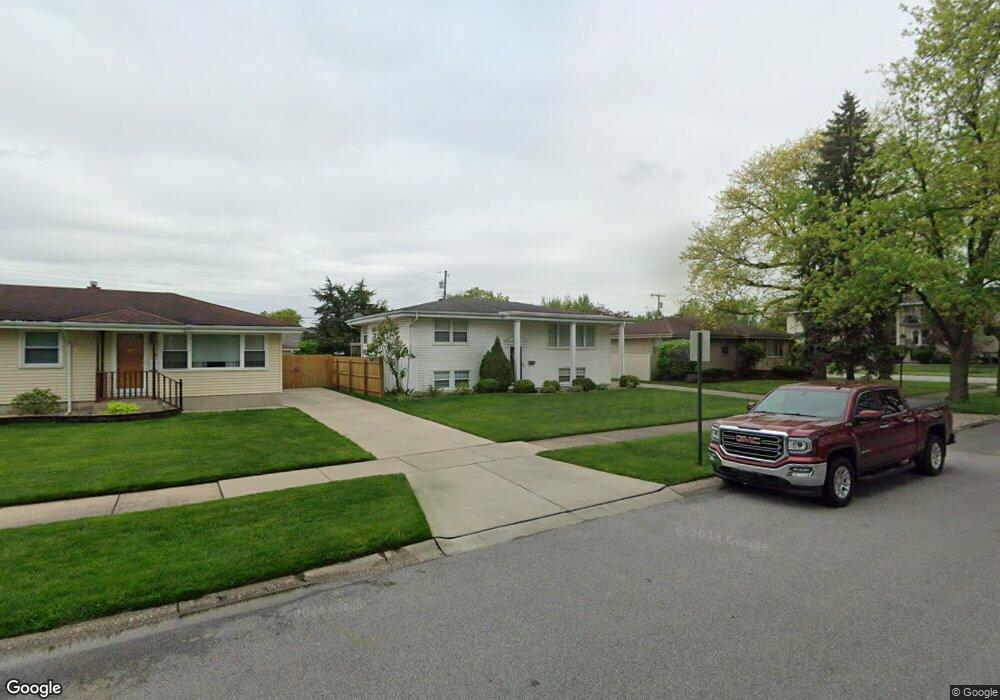
3010 97th Place Highland, IN 46322
Estimated Value: $313,500 - $400,000
4
Beds
2
Baths
2,000
Sq Ft
$173/Sq Ft
Est. Value
About This Home
This home is located at 3010 97th Place, Highland, IN 46322 and is currently estimated at $346,875, approximately $173 per square foot. 3010 97th Place is a home located in Lake County with nearby schools including Highland High School and Calumet Christian School.
Ownership History
Date
Name
Owned For
Owner Type
Purchase Details
Closed on
Sep 29, 2025
Sold by
Sandoval Lillian C
Bought by
Mitcheltree Zachary and Martino Kylie M
Current Estimated Value
Home Financials for this Owner
Home Financials are based on the most recent Mortgage that was taken out on this home.
Original Mortgage
$265,109
Outstanding Balance
$265,109
Interest Rate
6.58%
Mortgage Type
FHA
Estimated Equity
$81,766
Purchase Details
Closed on
Feb 13, 2015
Sold by
Sandoval Lillian C and Ferguson Lillian C
Bought by
Sandoval Lillian C
Home Financials for this Owner
Home Financials are based on the most recent Mortgage that was taken out on this home.
Original Mortgage
$164,740
Interest Rate
3.75%
Mortgage Type
FHA
Purchase Details
Closed on
Mar 24, 2006
Sold by
Staska Heather
Bought by
Ferguson Lillian C
Home Financials for this Owner
Home Financials are based on the most recent Mortgage that was taken out on this home.
Original Mortgage
$169,955
Interest Rate
6.33%
Mortgage Type
FHA
Create a Home Valuation Report for This Property
The Home Valuation Report is an in-depth analysis detailing your home's value as well as a comparison with similar homes in the area
Home Values in the Area
Average Home Value in this Area
Purchase History
| Date | Buyer | Sale Price | Title Company |
|---|---|---|---|
| Mitcheltree Zachary | -- | Northwest Indiana Title | |
| Sandoval Lillian C | -- | None Available | |
| Ferguson Lillian C | -- | Chicago Title Insurance Co |
Source: Public Records
Mortgage History
| Date | Status | Borrower | Loan Amount |
|---|---|---|---|
| Open | Mitcheltree Zachary | $265,109 | |
| Previous Owner | Sandoval Lillian C | $164,740 | |
| Previous Owner | Ferguson Lillian C | $169,955 |
Source: Public Records
Tax History Compared to Growth
Tax History
| Year | Tax Paid | Tax Assessment Tax Assessment Total Assessment is a certain percentage of the fair market value that is determined by local assessors to be the total taxable value of land and additions on the property. | Land | Improvement |
|---|---|---|---|---|
| 2024 | $6,150 | $255,500 | $40,800 | $214,700 |
| 2023 | $2,152 | $237,000 | $40,800 | $196,200 |
| 2022 | $2,152 | $215,200 | $40,800 | $174,400 |
| 2021 | $1,938 | $193,800 | $34,100 | $159,700 |
| 2020 | $1,859 | $185,900 | $34,100 | $151,800 |
| 2019 | $1,812 | $176,700 | $34,100 | $142,600 |
| 2018 | $2,022 | $170,300 | $34,100 | $136,200 |
| 2017 | $1,979 | $164,400 | $34,100 | $130,300 |
| 2016 | $1,890 | $158,600 | $34,100 | $124,500 |
| 2014 | $1,791 | $165,200 | $34,100 | $131,100 |
| 2013 | -- | $153,800 | $34,100 | $119,700 |
Source: Public Records
Map
Nearby Homes
- 3122 44th St
- 9841 Kennedy Ave
- 1951 W Ash St
- 3136 Lois Place
- 2649 Georgetowne Dr Unit B2
- 10010 Kennedy Ave
- 9505 Kennedy Ave
- 9414 Saric Dr
- 10114 Kennedy Ave
- 9417 Kennedy Ave
- 9343 Saric Dr
- 9624 O Day Dr
- 3443 43rd St
- 3210 O Day Dr
- 8032 Kennedy Ave
- 2741 41st St
- 9307 Grace St
- 2343 99th St Unit 1A
- 9132 Highland St
- 9949 Branton Ave Unit 2B