Estimated Value: $90,768 - $166,000
2
Beds
1
Bath
1,108
Sq Ft
$111/Sq Ft
Est. Value
About This Home
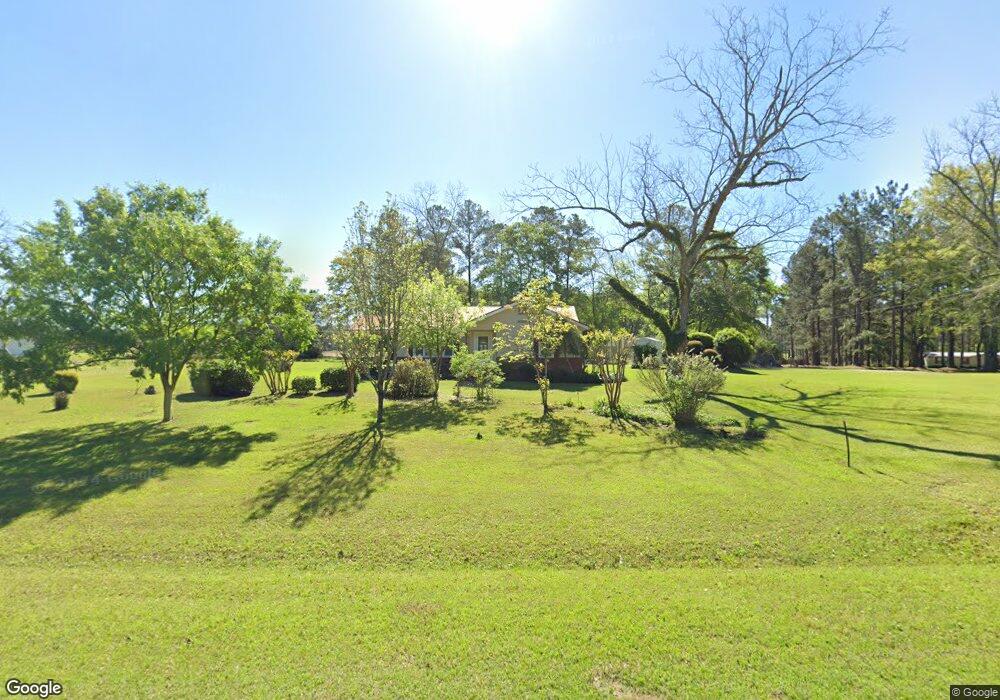
This home is located at 3010 Ga Highway 111 N, Cairo, GA 39827 and is currently estimated at $122,923, approximately $110 per square foot. 3010 Ga Highway 111 N is a home located in Grady County with nearby schools including Cairo High School and Raev Academy.
Ownership History
Date
Name
Owned For
Owner Type
Purchase Details
Closed on
Mar 16, 2021
Sold by
Garrett Del Wayne
Bought by
Garrett Del Wayne and Garrett Renee
Current Estimated Value
Purchase Details
Closed on
Jan 24, 2019
Sold by
Garrett Renee L
Bought by
Garrett Del Wayne
Purchase Details
Closed on
Apr 7, 2014
Sold by
Garrett Del Wayne
Bought by
Garrett Renee L
Purchase Details
Closed on
Aug 30, 2005
Sold by
Garrett Michael Ray
Bought by
Garrett Del Wayne
Purchase Details
Closed on
Jan 6, 2004
Sold by
Garrett Renee L
Bought by
Garrett Michael Ray
Purchase Details
Closed on
Dec 2, 2003
Sold by
Garrett Renee L
Bought by
Garrett Renee L
Purchase Details
Closed on
Nov 25, 2003
Sold by
Garrett Renee L
Bought by
Garrett Renee L
Purchase Details
Closed on
Nov 4, 1998
Sold by
Wadsworth Maude B Mrs
Bought by
Garrett Renee L
Purchase Details
Closed on
May 6, 1944
Bought by
Wadsworth Maude B Mrs
Create a Home Valuation Report for This Property
The Home Valuation Report is an in-depth analysis detailing your home's value as well as a comparison with similar homes in the area
Home Values in the Area
Average Home Value in this Area
Purchase History
| Date | Buyer | Sale Price | Title Company |
|---|---|---|---|
| Garrett Del Wayne | -- | -- | |
| Garrett Del Wayne | -- | -- | |
| Garrett Renee L | -- | -- | |
| Garrett Del Wayne | -- | -- | |
| Garrett Michael Ray | -- | -- | |
| Garrett Renee L | -- | -- | |
| Garrett Renee L | -- | -- | |
| Garrett Renee L | $30,000 | -- | |
| Wadsworth Maude B Mrs | -- | -- |
Source: Public Records
Tax History Compared to Growth
Tax History
| Year | Tax Paid | Tax Assessment Tax Assessment Total Assessment is a certain percentage of the fair market value that is determined by local assessors to be the total taxable value of land and additions on the property. | Land | Improvement |
|---|---|---|---|---|
| 2024 | $795 | $32,469 | $3,111 | $29,358 |
| 2023 | $597 | $25,992 | $2,340 | $23,652 |
| 2022 | $597 | $25,992 | $2,340 | $23,652 |
| 2021 | $803 | $25,992 | $2,340 | $23,652 |
| 2020 | $806 | $25,992 | $2,340 | $23,652 |
| 2019 | $600 | $25,992 | $2,340 | $23,652 |
| 2018 | $558 | $25,992 | $2,340 | $23,652 |
| 2017 | $527 | $25,992 | $2,340 | $23,652 |
| 2016 | $460 | $23,568 | $2,340 | $21,228 |
| 2015 | $480 | $23,568 | $2,340 | $21,228 |
| 2014 | $649 | $23,568 | $2,340 | $21,228 |
| 2013 | -- | $24,912 | $5,040 | $19,872 |
Source: Public Records
Map
Nearby Homes
- 1016 Richter Rd
- 158 Woodridge Ln
- 105 Woodridge Ln
- 264 Woodridge Ln
- 414 Woodland Rd
- 1725 Tract 2 Hwy 84w
- 1725 Tract #1 Hwy 84w
- 00 State Route 188
- 0 State Route 188
- 000 15th Ave Nw -- Tract 2
- 000 15th Ave Nw -- Tract 1
- 1420 Parallel Dr NW
- 1490 Magnolia Dr
- 1200 15th Ave NW
- 189 Sabino Dr
- 1210 Elkins Rd
- 1500 15th Ave NW
- 00 6th St NW
- Lot 1 Crine Blvd
- 1520 Upper Hawthorne Trail
- 2577 Ga Highway 111 N
- 2566 Ga Highway 111 N
- 128 Old Egg Rd
- 102 Old Egg Rd
- 2957 Ga-111
- 155 Old Egg Rd
- 2954 Ga Highway 111 N
- 2940 Ga Highway 111 N
- 2977 Ga Highway 111 N
- 2928 Ga Highway 111 N
- 183 Old Egg Rd
- 140 Old Egg Rd
- 232 Old Egg Rd
- 241 Old Egg Rd
- 218 Georgia 111
- 248 Old Egg Rd
- 115 Ga Highway 93 N
- 115 Ga Highway 93 N
- 147 Ga Highway 93 N
- 2040 Ga Highway 111 N