Estimated Value: $297,000 - $328,000
3
Beds
3
Baths
1,738
Sq Ft
$179/Sq Ft
Est. Value
About This Home
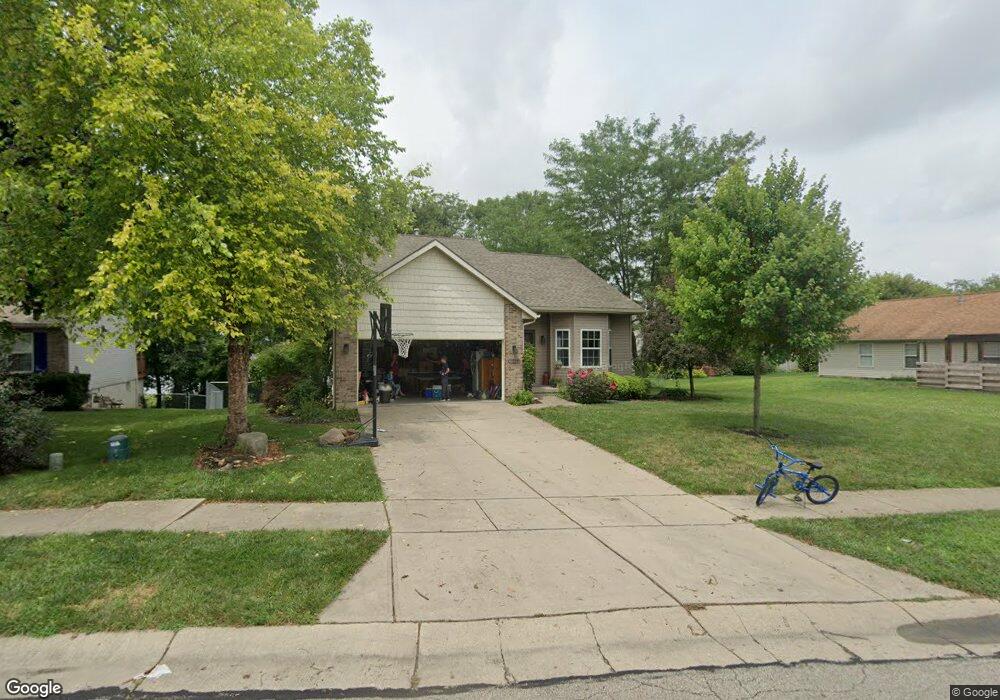
This home is located at 3010 W Barnhill Place, Xenia, OH 45385 and is currently estimated at $310,516, approximately $178 per square foot. 3010 W Barnhill Place is a home located in Greene County with nearby schools including Xenia High School and Summit Academy Community School for Alternative Learners - Xenia.
Ownership History
Date
Name
Owned For
Owner Type
Purchase Details
Closed on
Mar 23, 2007
Sold by
Moden Christopher and Moden Tamara L
Bought by
Wallace Benjamin T and Wallace Elizabeth A
Current Estimated Value
Home Financials for this Owner
Home Financials are based on the most recent Mortgage that was taken out on this home.
Original Mortgage
$160,000
Interest Rate
6.31%
Mortgage Type
Unknown
Purchase Details
Closed on
Jan 21, 2000
Sold by
Crossman Communities Of Ohio Inc
Bought by
Moden Christopher and Moden Tamara L
Home Financials for this Owner
Home Financials are based on the most recent Mortgage that was taken out on this home.
Original Mortgage
$148,620
Interest Rate
7.84%
Mortgage Type
FHA
Create a Home Valuation Report for This Property
The Home Valuation Report is an in-depth analysis detailing your home's value as well as a comparison with similar homes in the area
Home Values in the Area
Average Home Value in this Area
Purchase History
| Date | Buyer | Sale Price | Title Company |
|---|---|---|---|
| Wallace Benjamin T | $169,900 | Attorney | |
| Moden Christopher | $154,200 | -- |
Source: Public Records
Mortgage History
| Date | Status | Borrower | Loan Amount |
|---|---|---|---|
| Closed | Wallace Benjamin T | $160,000 | |
| Closed | Moden Christopher | $148,620 |
Source: Public Records
Tax History Compared to Growth
Tax History
| Year | Tax Paid | Tax Assessment Tax Assessment Total Assessment is a certain percentage of the fair market value that is determined by local assessors to be the total taxable value of land and additions on the property. | Land | Improvement |
|---|---|---|---|---|
| 2024 | $3,501 | $81,830 | $19,850 | $61,980 |
| 2023 | $3,501 | $81,830 | $19,850 | $61,980 |
| 2022 | $3,085 | $61,500 | $13,230 | $48,270 |
| 2021 | $3,127 | $61,500 | $13,230 | $48,270 |
| 2020 | $2,996 | $61,500 | $13,230 | $48,270 |
| 2019 | $2,568 | $49,620 | $10,090 | $39,530 |
| 2018 | $2,578 | $49,620 | $10,090 | $39,530 |
| 2017 | $2,530 | $49,620 | $10,090 | $39,530 |
| 2016 | $2,531 | $47,810 | $10,090 | $37,720 |
| 2015 | $2,538 | $47,810 | $10,090 | $37,720 |
| 2014 | $2,430 | $47,810 | $10,090 | $37,720 |
Source: Public Records
Map
Nearby Homes
- 1248 Prem Place
- 1318 Prem Place
- 1282 Baybury Ave
- 1298 Baybury Ave
- 1304 Baybury Ave
- 1293 Baybury Ave
- 1272 Baybury Ave
- 1292 Baybury Ave
- 1161 Shannon Ln
- 1213 Prem Place
- 2705 Tennessee Dr
- 1474 Hawkshead St
- 2821 Raxit Ct
- 2692 Kingman Dr
- Chatham Plan at Edenbridge
- Bellamy Plan at Edenbridge
- Holcombe Plan at Edenbridge
- Henley Plan at Edenbridge
- Newcastle Plan at Edenbridge
- 2784 Greystoke Dr
- 3018 W Barnhill Place
- 1280 Prem Place
- 1290 Prem Place
- 3026 W Barnhill Place
- 3015 W Barnhill Place
- 1272 Prem Place
- 3009 W Barnhill Place
- 1225 Shannon Ln
- 1260 Prem Place
- 1266 Prem Place
- 3001 W Barnhill Place
- 1219 Shannon Ln
- 1241 Shannon Ln
- 1283 Shannon Ln
- 1253 Shannon Ln
- 1287 Prem Place
- 1254 Prem Place
- 1279 Prem Place
- 1291 Shannon Ln
- 1295 Prem Place