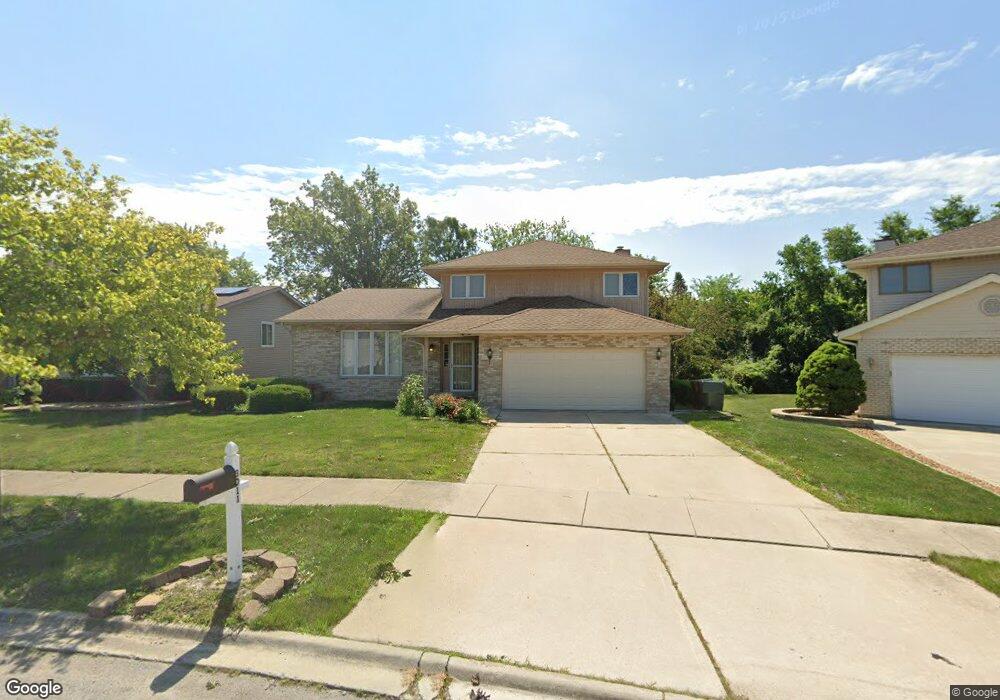
3011 Surrey Ln Hazel Crest, IL 60429
Stonebridge NeighborhoodEstimated Value: $293,000 - $321,000
3
Beds
3
Baths
2,558
Sq Ft
$120/Sq Ft
Est. Value
About This Home
This home is located at 3011 Surrey Ln, Hazel Crest, IL 60429 and is currently estimated at $308,111, approximately $120 per square foot. 3011 Surrey Ln is a home located in Cook County with nearby schools including Mae Jemison School, Prairie-Hills Junior High School, and Hillcrest High School.
Ownership History
Date
Name
Owned For
Owner Type
Purchase Details
Closed on
Dec 5, 2008
Sold by
Gardner House Willie M
Bought by
Forrest Brenda M
Current Estimated Value
Home Financials for this Owner
Home Financials are based on the most recent Mortgage that was taken out on this home.
Original Mortgage
$206,148
Outstanding Balance
$137,339
Interest Rate
6.3%
Mortgage Type
FHA
Estimated Equity
$170,772
Purchase Details
Closed on
Sep 13, 2002
Sold by
Hargrave Robert and Hargrave Juanita
Bought by
House Willie E and Gardner House Willie M
Home Financials for this Owner
Home Financials are based on the most recent Mortgage that was taken out on this home.
Original Mortgage
$200,355
Interest Rate
10.12%
Purchase Details
Closed on
Jun 20, 1994
Sold by
Beverly Trust Company
Bought by
Hargrave Robert O and Hargrave Juanita
Home Financials for this Owner
Home Financials are based on the most recent Mortgage that was taken out on this home.
Original Mortgage
$66,000
Interest Rate
5.62%
Create a Home Valuation Report for This Property
The Home Valuation Report is an in-depth analysis detailing your home's value as well as a comparison with similar homes in the area
Home Values in the Area
Average Home Value in this Area
Purchase History
| Date | Buyer | Sale Price | Title Company |
|---|---|---|---|
| Forrest Brenda M | $210,000 | 1St American Title | |
| House Willie E | $211,000 | -- | |
| Hargrave Robert O | $163,500 | -- |
Source: Public Records
Mortgage History
| Date | Status | Borrower | Loan Amount |
|---|---|---|---|
| Open | Forrest Brenda M | $206,148 | |
| Previous Owner | House Willie E | $200,355 | |
| Previous Owner | Hargrave Robert O | $66,000 |
Source: Public Records
Tax History Compared to Growth
Tax History
| Year | Tax Paid | Tax Assessment Tax Assessment Total Assessment is a certain percentage of the fair market value that is determined by local assessors to be the total taxable value of land and additions on the property. | Land | Improvement |
|---|---|---|---|---|
| 2024 | $11,286 | $24,723 | $3,261 | $21,462 |
| 2023 | $5,372 | $28,000 | $3,261 | $24,739 |
| 2022 | $5,372 | $13,474 | $2,877 | $10,597 |
| 2021 | $5,292 | $13,474 | $2,877 | $10,597 |
| 2020 | $6,967 | $13,474 | $2,877 | $10,597 |
| 2019 | $6,935 | $13,787 | $2,685 | $11,102 |
| 2018 | $6,717 | $13,787 | $2,685 | $11,102 |
| 2017 | $7,455 | $15,674 | $2,685 | $12,989 |
| 2016 | $6,690 | $13,940 | $2,301 | $11,639 |
| 2015 | $6,338 | $13,940 | $2,301 | $11,639 |
| 2014 | $7,212 | $15,770 | $2,301 | $13,469 |
| 2013 | $7,286 | $17,844 | $2,301 | $15,543 |
Source: Public Records
Map
Nearby Homes
- 5 E Carriageway Dr Unit 210
- 7 E Carriageway Dr Unit 311
- 17622 Oakwood Dr
- 2908 Buttonwood Walk
- 17804 Pebblewood Ln
- 17613 Grandview Dr
- 17714 Dogwood Ln
- 17405 Longfellow Ave
- 3111 Smoke Tree Ct
- 17803 Dogwood Ln
- 2912 175th St
- 2805 Knollwood Place
- 17805 Dogwood Ln
- 17910 Millstone Rd
- 2900 175th St
- 3107 Longfellow Ave
- 17410 Emerson Ave
- 2722 Cherrywood Ln
- 2711 Larkspur Ln
- 2814 Lexington Dr
- 3009 Surrey Ln
- 3013 Surrey Ln
- 17712 Stonebridge Dr
- 3007 Surrey Ln
- 17714 Stonebridge Dr
- 3101 Surrey Ln
- 17710 Stonebridge Dr
- 3102 Oakwood Dr
- 3100 Oakwood Dr
- 17615 Balmoral Ln
- 3005 Surrey Ln
- 3103 Surrey Ln
- 3104 Oakwood Dr
- 17708 Stonebridge Dr
- 17613 Balmoral Ln
- 3106 Oakwood Dr
- 3003 Surrey Ln
- 17616 Balmoral Ln
- 17706 Stonebridge Dr
- 3105 Surrey Ln